
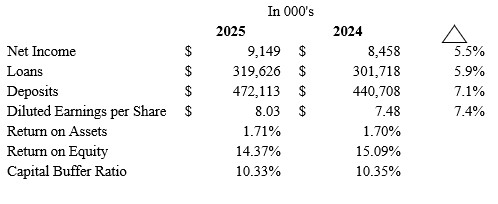
Trinity Bank Reports Results for 2025 Net Income Up 8.2% to $9,149,000
 Seoul bounces as Asian markets look to recover from rout

 North Korea's Kim unveils plans for 10,000-tonne warships, nuclear navy

 Ghosts of Gijon linger as new World Cup format encourages collusion

 Panama out of World Cup after defeat to Croatia

 Wizards choose teenage talent Dybantsa with No.1 pick in NBA Draft

 Tuchel insists England remain on course at World Cup despite Ghana draw

 Bellingham rues England's 'second game fever' after Ghana draw

 Meta offers lower cost glasses as wearables competition heats up

 England left frustrated by Ghana in World Cup draw

 Grieving Deschamps to miss France's final World Cup group game

 Two-goal Ronaldo delights in silencing critics after 'attacks'

 Morocco squad 'supporting' Hakimi despite impending rape trial

 Airbus to inspect 16 A380s after cracks found on plane wings

 Bolivian government says cleared all protest roadblocks

 France has hottest-ever day as 'unbearable' heatwave keeps scorching Europe

 Ronaldo double fires Portugal, England eye last 32

 Hollywood powerhouses bring AI fight to Europe

 What is driving Europe's heatwave?

 Spain's Oyarzabal happy to play through pain at World Cup

 US Supreme Court rules against man whose dreadlocks were cut off in prison

 UN to begin evacuating stranded Mideast sailors after US-Iran talks

 Tech drags down world stocks, oil dips on supply hopes

 Shootout traps tourists at Rio sunrise lookout

 Heatwave sparks health warnings across Europe

 Hundreds of schools close as UK braces for record-breaking heatwave

RETURN ON ASSETS 1.71%
RETURN ON EQUITY 14.37%
FORT WORTH, TX / ACCESS Newswire / February 9, 2026 / Trinity Bank N.A. (OTC PINK:TYBT) today announced operating results for the fourth quarter and the twelve months ending December 31, 2025.
Results of Operation
For the fourth quarter of 2025, Trinity Bank, N.A., reported Net Income after Taxes of $2,241,000, an increase of 2.9% over fourth quarter 2024 earnings of $2,178,000. Earnings per diluted common share for the fourth quarter 2025 amounted to $1.96, an increase of 2.1% over fourth quarter 2024 results of $1.92 per diluted common share.
For fiscal year 2025, Net Income after Taxes was $9,149,000, an increase of 8.2% over 2024 results of $8,458,000. Earnings per diluted common share for fiscal year 2025 were $8.03, an increase of 7.3% over 2024 results of $7.48 per diluted common share.
Co-Chairman and CEO Matt R. Opitz stated, "Trinity Bank's fourth quarter results capped off a strong year of earnings. 2025's performance represents the most profitable year in history for Trinity Bank. We invested heavily in people and processes throughout the year to ensure Trinity Bank remains positioned for continued, long-term success. Achieving a record year, despite these significant investments, shows our commitment to recruiting and retaining top-quality people, and developing efficient processes, is working well.
"While there are risks, both domestically and internationally, that could play a role in economic growth in 2026, we are optimistic about the US and Texas economies. Consumers and businesses have proven resilient, and we are encouraged by our customers' optimism for the year ahead."
"As always, thank you to our hard-working staff. With their dedication, the economy positioned for growth and Trinity's strong balance sheet, we are confident in our ability to maintain this positive momentum in 2026."
Page 2 - Trinity Bank fourth quarter 2025 earnings

Page 3 - Trinity Bank fourth quarter 2025 earnings
Trinity Bank, N.A. is a commercial bank that began operations May 28, 2003. For a full financial statement, visit Trinity Bank's website: www.trinitybk.com Regulatory reporting format is also available at www.fdic.gov.
###
For information contact:
Richard Burt
Executive Vice President
Trinity Bank
817-763-9966
This Press Release may contain certain forward-looking statements within the meaning of the Private Securities Litigation Reform Act of 1995 regarding future financial conditions, results of operations and the Bank's business operations. Such forward-looking statements involve risks, uncertainties and assumptions, including, but not limited to, monetary policy and general economic conditions in Texas and the greater Dallas-Fort Worth metropolitan area, the risks of changes in interest rates on the level and composition of deposits, loan demand and the values of loan collateral, securities and interest rate protection agreements, the actions of competitors and customers, the success of the Bank in implementing its strategic plan, the failure of the assumptions underlying the reserves for loan losses and the estimations of values of collateral and various financial assets and liabilities, that the costs of technological changes are more difficult or expensive than anticipated, the effects of regulatory restrictions imposed on banks generally, any changes in fiscal, monetary or regulatory policies and other uncertainties as discussed in the Bank's Registration Statement on Form SB‑1 filed with the Office of the Comptroller of the Currency. Should one or more of these risks or uncertainties materialize, or should these underlying assumptions prove incorrect, actual outcomes may vary materially from outcomes expected or anticipated by the Bank. A forward-looking statement may include a statement of the assumptions or bases underlying the forward‑looking statement. The Bank believes it has chosen these assumptions or bases in good faith and that they are reasonable. However, the Bank cautions you that assumptions or bases almost always vary from actual results, and the differences between assumptions or bases and actual results can be material. The Bank undertakes no obligation to publicly update or otherwise revise any forward‑looking statements, whether as a result of new information, future events or otherwise, unless the securities laws require the Bank to do so.
TRINITY BANK N.A.
(Unaudited)
(Dollars in thousands, except per share data)
Quarter Ended | Twelve Months Ending | |||||||||||||||||||
December 31 | % | December 31 | % | |||||||||||||||||
EARNINGS SUMMARY | 2025 | 2024 | Change | 2025 | 2024 | Change | ||||||||||||||
Interest income | $ | 7,774 | $ | 7,426 | 4.7 | % | $ | 29,972 | $ | 28,579 | 4.9 | % | ||||||||
Interest expense | 2,441 | 2,681 | -9.0 | % | 9,322 | 10,972 | -15.0 | % | ||||||||||||
Net Interest Income | 5,333 | 4,745 | 12.4 | % | 20,650 | 17,607 | 17.3 | % | ||||||||||||
Service charges on deposits | 76 | 70 | 8.6 | % | 307 | 256 | 19.9 | % | ||||||||||||
Other income | 225 | 112 | 100.9 | % | 599 | 459 | 30.5 | % | ||||||||||||
Total Non Interest Income | 301 | 182 | 65.4 | % | 906 | 715 | 26.7 | % | ||||||||||||
Salaries and benefits expense | 2,015 | 1,343 | 50.0 | % | 7,028 | 5,254 | 33.8 | % | ||||||||||||
Occupancy and equipment expense | 155 | 117 | 32.5 | % | 572 | 495 | 15.6 | % | ||||||||||||
Other expense | 537 | 575 | -6.6 | % | 2,811 | 2,455 | 14.5 | % | ||||||||||||
Total Non Interest Expense | 2,707 | 2,035 | 33.0 | % | 10,411 | 8,204 | 26.9 | % | ||||||||||||
Pretax pre-provision income | 2,927 | 2,892 | 1.2 | % | 11,145 | 10,118 | 10.2 | % | ||||||||||||
Gain on sale of Securities | 9 | 1 | 9 | 2 | ||||||||||||||||
Gain on sale of Assets | 0 | 0 | 0 | 53 | ||||||||||||||||
Provision for Loan Losses | 200 | 350 | 200 | 350 | ||||||||||||||||
Earnings before income taxes | 2,736 | 2,543 | 7.6 | % | 10,954 | 9,823 | 11.5 | % | ||||||||||||
Provision for income taxes | 495 | 365 | 35.6 | % | 1,805 | 1,365 | 32.2 | % | ||||||||||||
Net Earnings | $ | 2,241 | $ | 2,178 | 2.9 | % | $ | 9,149 | $ | 8,458 | 8.2 | % | ||||||||
Basic earnings per share | 2.05 | 2.01 | 2.0 | % | 8.40 | 7.83 | 7.3 | % | ||||||||||||
Basic weighted average shares | 1,093 | 1,085 | 1,089 | 1,080 | ||||||||||||||||
outstanding | ||||||||||||||||||||
Diluted earnings per share - estimate | 1.96 | 1.92 | 2.1 | % | 8.03 | 7.48 | 7.4 | % | ||||||||||||
Diluted weighted average shares outstanding | 1,143 | 1,135 | 1,139 | 1,130 | ||||||||||||||||
Average for Quarter | Average for Twelve Months | |||||||||||||||||||
December 31 | % | December 31 | % | |||||||||||||||||
BALANCE SHEET SUMMARY | 2025 | 2024 | Change | 2025 | 2024 | Change | ||||||||||||||
Total loans | $ | 335,163 | $ | 297,595 | 12.6 | % | $ | 319,626 | $ | 301,718 | 5.9 | % | ||||||||
Total short term investments | 68,152 | 84,667 | -19.5 | % | 66,892 | 46,595 | 43.6 | % | ||||||||||||
FRB Stock | 468 | 438 | 6.8 | % | 459 | 436 | 5.3 | % | ||||||||||||
Total investment securities | 138,243 | 139,200 | -0.7 | % | 135,844 | 139,161 | -2.4 | % | ||||||||||||
Earning assets | 542,026 | 521,900 | 3.9 | % | 522,821 | 487,910 | 7.2 | % | ||||||||||||
Total assets | 559,186 | 529,766 | 5.6 | % | 535,354 | 495,755 | 8.0 | % | ||||||||||||
Noninterest bearing deposits | 143,277 | 140,237 | 2.2 | % | 137,953 | 132,835 | 3.9 | % | ||||||||||||
Interest bearing deposits | 346,772 | 331,293 | 4.7 | % | 334,160 | 307,873 | 8.5 | % | ||||||||||||
Total deposits | 490,049 | 471,529 | 3.9 | % | 472,113 | 440,708 | 7.1 | % | ||||||||||||
Fed Funds Purchased and Repurchase Agreements | 0 | 0 | N/M | 0 | 0 | N/M | ||||||||||||||
Shareholders' equity | $ | 66,283 | $ | 58,388 | 13.5 | % | $ | 63,666 | $ | 56,039 | 13.6 | % | ||||||||
TRINITY BANK N.A.
(Unaudited)
(Dollars in thousands, except per share data)
Average for Quarter Ending | ||||||||||||||
Dec 31, | Sept 30, | June 30, | March 31, | Dec 31, | ||||||||||
BALANCE SHEET SUMMARY | 2025 | 2025 | 2025 | 2025 | 2024 | |||||||||
Total loans | $ | 335,163 | $ | 323,165 | $ | 317,410 | $ | 302,369 | $ | 297,595 | ||||
Total short term investments | 68,152 | 77,027 | 66,510 | 53,950 | 84,667 | |||||||||
FRB Stock | 468 | 462 | 459 | 449 | 438 | |||||||||
Total investment securities | 138,243 | 134,857 | 133,949 | 136,314 | 139,200 | |||||||||
Earning assets | 542,026 | 535,511 | 518,327 | 493,082 | 521,900 | |||||||||
Total assets | 559,186 | 547,494 | 530,621 | 503,366 | 529,766 | |||||||||
Noninterest bearing deposits | 143,277 | 136,352 | 137,911 | 133,982 | 140,237 | |||||||||
Interest bearing deposits | 346,772 | 346,779 | 332,645 | 310,105 | 331,293 | |||||||||
Total deposits | 490,049 | 483,131 | 470,556 | 444,087 | 471,529 | |||||||||
Fed Funds Purchased and Repurchase Agreements | 0 | 0 | 0 | 0 | 0 | |||||||||
Shareholders' equity | $ | 66,283 | $ | 64,787 | $ | 62,680 | $ | 60,843 | $ | 58,388 | ||||
Quarter Ended | ||||||||||||||
Dec 31, | Sept 30, | June 30, | March 31, | Dec 31, | ||||||||||
HISTORICAL EARNINGS SUMMARY | 2025 | 2025 | 2025 | 2025 | 2024 | |||||||||
Interest income | $ | 7,774 | $ | 7,768 | $ | 7,455 | $ | 6,975 | $ | 7,426 | ||||
Interest expense | 2,441 | 2,442 | 2,295 | 2,149 | 2,681 | |||||||||
Net Interest Income | 5,333 | 5,326 | 5,160 | 4,826 | 4,745 | |||||||||
Service charges on deposits | 76 | 84 | 76 | 71 | 70 | |||||||||
Other income | 225 | 136 | 131 | 106 | 112 | |||||||||
Total Non Interest Income | 301 | 220 | 207 | 177 | 182 | |||||||||
Salaries and benefits expense | 2,015 | 1,774 | 1,731 | 1,508 | 1,343 | |||||||||
Occupancy and equipment expense | 155 | 155 | 140 | 123 | 117 | |||||||||
Other expense | 537 | 742 | 712 | 814 | 575 | |||||||||
Total Non Interest Expense | 2,707 | 2,671 | 2,583 | 2,445 | 2,035 | |||||||||
Pretax pre-provision income | 2,927 | 2,875 | 2,784 | 2,558 | 2,892 | |||||||||
Gain on sale of securities | 9 | (6 | ) | 0 | 6 | 1 | ||||||||
Gain on sale of Other Assets | 0 | 0 | 0 | 0 | 0 | |||||||||
Provision for Loan Losses | 200 | 0 | 0 | 0 | 350 | |||||||||
Earnings before income taxes | 2,736 | 2,869 | 2,784 | 2,564 | 2,543 | |||||||||
Provision for income taxes | 495 | 545 | 410 | 355 | 365 | |||||||||
Net Earnings | $ | 2,241 | $ | 2,324 | $ | 2,374 | $ | 2,209 | $ | 2,178 | ||||
Diluted earnings per share | $ | 1.96 | $ | 2.03 | $ | 2.09 | $ | 1.94 | $ | 1.92 | ||||
TRINITY BANK N.A.
(Unaudited)
(Dollars in thousands, except per share data)
Ending Balance | ||||||||||||||||||
Dec 31, | Sept 30, | June 30, | March 31, | Dec 31, | ||||||||||||||
HISTORICAL BALANCE SHEET | 2025 | 2025 | 2025 | 2025 | 2024 | |||||||||||||
Total loans | $ | 343,314 | $ | 341,633 | $ | 325,809 | $ | 304,944 | $ | 305,864 | ||||||||
FRB Stock | 472 | 462 | 461 | 456 | 439 | |||||||||||||
Total short term investments | 52,144 | 70,495 | 55,130 | 90,040 | 69,746 | |||||||||||||
Total investment securities | 141,254 | 136,981 | 132,989 | 124,619 | 138,306 | |||||||||||||
Total earning assets | 537,184 | 549,571 | 514,389 | 520,059 | 514,355 | |||||||||||||
Allowance for loan losses | (5,480 | ) | (5,592 | ) | (5,589 | ) | (5,586 | ) | (5,583 | ) | ||||||||
Premises and equipment | 4,009 | 4,011 | 4,079 | 4,044 | 4,123 | |||||||||||||
Other Assets | 17,644 | 13,290 | 14,296 | 10,297 | 9,339 | |||||||||||||
Total assets | 553,357 | 561,280 | 527,175 | 528,814 | 522,234 | |||||||||||||
Noninterest bearing deposits | 143,332 | 139,387 | 133,902 | 140,500 | 146,834 | |||||||||||||
Interest bearing deposits | 339,809 | 354,092 | 331,050 | 329,329 | 318,206 | |||||||||||||
Total deposits | 483,141 | 493,479 | 464,952 | 469,829 | 465,040 | |||||||||||||
Other Liabilities | 3,605 | 4,577 | 3,072 | 2,661 | 2,711 | |||||||||||||
Total liabilities | 486,746 | 498,056 | 468,024 | 472,490 | 467,751 | |||||||||||||
Shareholders' Equity Actual | 67,568 | 65,196 | 63,664 | 62,276 | 59,758 | |||||||||||||
Unrealized Gain/Loss - AFS | (957 | ) | (1,972 | ) | (4,513 | ) | (5,952 | ) | (5,275 | ) | ||||||||
Total Equity | $ | 66,611 | $ | 63,224 | $ | 59,151 | $ | 56,324 | $ | 54,483 | ||||||||
Quarter Ending | ||||||||||||||||||
Dec 31, | Sept 30, | June 30, | March 31, | Dec. 31, | ||||||||||||||
NONPERFORMING ASSETS | 2025 | 2025 | 2025 | 2025 | 2024 | |||||||||||||
Nonaccrual loans | $ | 0 | $ | 341 | $ | 424 | $ | 949 | $ | 1,047 | ||||||||
Restructured loans | 0 | 0 | 0 | 0 | 0 | |||||||||||||
Other real estate & foreclosed assets | 0 | 0 | 0 | 0 | 0 | |||||||||||||
Accruing loans past due 90 days or more | 0 | 0 | 0 | 0 | 0 | |||||||||||||
Total nonperforming assets | $ | 0 | $ | 341 | $ | 424 | $ | 949 | $ | 1,047 | ||||||||
Accruing loans past due 30-89 days | $ | 0 | $ | 0 | $ | 0 | $ | 1,000 | $ | 0 | ||||||||
Total nonperforming assets as a percentage | ||||||||||||||||||
of loans and foreclosed assets | 0.00 | % | 0.10 | % | 0.13 | % | 0.31 | % | 0.34 | % | ||||||||
TRINITY BANK N.A.
(Unaudited)
(Dollars in thousands, except per share data)
Quarter Ending | ||||||||||||||||||
ALLOWANCE FOR | Dec 31, | Sept 30, | June 30, | March 31, | Dec 31, | |||||||||||||
LOAN LOSSES | 2025 | 2025 | 2025 | 2025 | 2024 | |||||||||||||
Balance at beginning of period | $ | 5,583 | $ | 5,583 | $ | 5,583 | $ | 5,583 | $ | 5,230 | ||||||||
Loans charged off | 314 | 0 | 0 | 0 | 0 | |||||||||||||
Loan recoveries | 10 | 9 | 3 | 3 | 3 | |||||||||||||
Net (charge-offs) recoveries | 304 | 9 | 3 | 3 | 3 | |||||||||||||
Provision for loan losses | 200 | 0 | 0 | 0 | 350 | |||||||||||||
Balance at end of period | $ | 5,479 | $ | 5,592 | $ | 5,586 | $ | 5,586 | $ | 5,583 | ||||||||
Allowance for loan losses | ||||||||||||||||||
as a percentage of total loans | 1.60 | % | 1.64 | % | 1.72 | % | 1.83 | % | 1.83 | % | ||||||||
Allowance for loan losses | ||||||||||||||||||
as a percentage of nonperforming assets | 0.00 | % | 1640 | % | 1318 | % | 589 | % | 533 | % | ||||||||
Net charge-offs (recoveries) as a | ||||||||||||||||||
percentage of average loans | 0.09 | % | 0.00 | % | 0.00 | % | 0.00 | % | 0.00 | % | ||||||||
Provision for loan losses | ||||||||||||||||||
as a percentage of average loans | 0.06 | % | 0.00 | % | 0.00 | % | 0.00 | % | 0.11 | % | ||||||||
Quarter Ending | ||||||||||||||
Dec 31, | Sept 30, | June 30, | March 31, | Dec 31, | ||||||||||
SELECTED RATIOS | 2025 | 2025 | 2025 | 2025 | 2024 | |||||||||
Return on average assets (annualized) | 1.60 | % | 1.70 | % | 1.79 | % | 1.76 | % | 1.64 | % | ||||
Return on average equity (annualized) | 13.81 | % | 15.30 | % | 16.69 | % | 15.67 | % | 15.85 | % | ||||
Return on average equity (excluding unrealized gain on investments) | 13.52 | % | 14.35 | % | 15.15 | % | 14.52 | % | 14.92 | % | ||||
Average shareholders' equity to average assets | 11.85 | % | 11.83 | % | 11.81 | % | 12.09 | % | 11.02 | % | ||||
Yield on earning assets (tax equivalent) | 5.97 | % | 6.03 | % | 5.98 | % | 5.72 | % | 6.09 | % | ||||
Effective Cost of Funds | 1.78 | % | 1.82 | % | 1.77 | % | 1.75 | % | 2.25 | % | ||||
Net interest margin (tax equivalent) | 4.18 | % | 4.21 | % | 4.21 | % | 3.97 | % | 3.84 | % | ||||
Efficiency ratio (tax equivalent) | 45.4 | % | 45.6 | % | 45.6 | % | 46.2 | % | 39.0 | % | ||||
End of period book value per common share | $ | 60.94 | $ | 57.84 | $ | 54.42 | $ | 51.82 | $ | 50.21 | ||||
End of period book value (excluding unrealized gain/loss on investments) | $ | 61.82 | $ | 59.65 | $ | 58.57 | $ | 57.29 | $ | 55.08 | ||||
End of period common shares outstanding (in 000's) | 1,093 | 1,093 | 1,087 | 1,087 | 1,085 | |||||||||
TRINITY BANK N.A.
(Unaudited)
(Dollars in thousands, except per share data)
Twelve Months Ending | ||||||||||||||||||||||||||||||
December 31, 2025 | December 31, 2024 | |||||||||||||||||||||||||||||
Tax | Tax | |||||||||||||||||||||||||||||
Average | Equivalent | Average | Equivalent | |||||||||||||||||||||||||||
YIELD ANALYSIS | Balance | Interest | Yield | Yield | Balance | Interest | Yield | Yield | ||||||||||||||||||||||
Interest Earning Assets: | ||||||||||||||||||||||||||||||
Short term investment | $ | 66,891 | $ | 2,887 | 4.32 | % | 4.32 | % | $ | 46,595 | $ | 2,417 | 5.19 | % | 5.19 | % | ||||||||||||||
FRB Stock | 459 | 27 | 6.00 | % | 6.00 | % | 436 | 26 | 6.00 | % | 6.00 | % | ||||||||||||||||||
Taxable securities | 1,720 | 75 | 0.00 | % | 0.00 | % | 0 | 0 | 0.00 | % | 0.00 | % | ||||||||||||||||||
Tax Free securities | 134,124 | 4,595 | 3.43 | % | 4.34 | % | 139,161 | 4,486 | 3.22 | % | 4.03 | % | ||||||||||||||||||
Loans | 319,626 | 22,387 | 7.00 | % | 7.00 | % | 301,718 | 21,651 | 7.18 | % | 7.18 | % | ||||||||||||||||||
Total Interest Earning Assets | 522,820 | 29,972 | 5.73 | % | 5.97 | % | 487,910 | 28,579 | 5.86 | % | 6.09 | % | ||||||||||||||||||
Noninterest Earning Assets: | ||||||||||||||||||||||||||||||
Cash and due from banks | 5,347 | 5,712 | ||||||||||||||||||||||||||||
Other assets | 12,776 | 7,363 | ||||||||||||||||||||||||||||
Allowance for loan losses | (5,589 | ) | (5,230 | ) | ||||||||||||||||||||||||||
Total Noninterest Earning Assets | 12,534 | 7,845 | ||||||||||||||||||||||||||||
Total Assets | $ | 535,354 | $ | 495,755 | ||||||||||||||||||||||||||
Interest Bearing Liabilities: | ||||||||||||||||||||||||||||||
Transaction and Money Market accounts | $ | 213,493 | $ | 4,610 | 2.16 | % | 2.16 | % | $ | 200,832 | $ | 6,125 | 3.05 | % | 3.05 | % | ||||||||||||||
Certificates and other time deposits | 120,670 | 4,711 | 3.90 | % | 3.90 | % | 107,041 | 4,846 | 4.53 | % | 4.53 | % | ||||||||||||||||||
Other borrowings | 0 | 0 | 0.00 | % | 0.00 | % | 0 | 0 | 0.00 | % | 0.00 | % | ||||||||||||||||||
Total Interest Bearing Liabilities | 334,163 | 9,322 | 2.79 | % | 2.79 | % | 307,873 | 10,972 | 3.56 | % | 3.56 | % | ||||||||||||||||||
Noninterest Bearing Liabilities: | ||||||||||||||||||||||||||||||
Demand deposits | 137,951 | 132,835 | ||||||||||||||||||||||||||||
Other liabilities | 3,471 | 3,074 | ||||||||||||||||||||||||||||
Shareholders' Equity | 59,769 | 51,974 | ||||||||||||||||||||||||||||
Total Liabilities and Shareholders Equity | $ | 535,354 | $ | 495,755 | ||||||||||||||||||||||||||
Net Interest Income and Spread | $ | 188,657 | $ | 20,650 | 2.94 | % | 3.18 | % | $ | 180,037 | $ | 17,607 | 2.29 | % | 2.52 | % | ||||||||||||||
Net Interest Margin | 3.95 | % | 4.18 | % | 3.61 | % | 3.84 | % | ||||||||||||||||||||||
TRINITY BANK N.A.
(Unaudited)
(Dollars in thousands, except per share data)
December 31 | December 31 | |||||||
2025 | % | 2024 | % | |||||
LOAN PORTFOLIO | ||||||||
Commercial and industrial | $ | 172,563 | 50.26 | % | $ | 168,145 | 54.97 | % |
Real estate: | ||||||||
Commercial | 108,360 | 31.56 | % | 96,441 | 31.53 | % | ||
Residential | 19,262 | 5.61 | % | 11,209 | 3.66 | % | ||
Construction and development | 43,014 | 12.53 | % | 29,933 | 9.79 | % | ||
Consumer | 115 | 0.03 | % | 136 | 0.04 | % | ||
Total loans | $ | 343,314 | 100.00 | % | $ | 305,864 | 100.00 | % |
December 31 | December 31 | |||
2025 | 2024 | |||
REGULATORY CAPITAL DATA | ||||
Tier 1 Capital | $ | 67,569 | $ | 59,758 |
Total Capital (Tier 1 + Tier 2) | $ | 72,524 | $ | 64,147 |
Total Risk-Adjusted Assets | $ | 395,599 | $ | 349,667 |
Tier 1 Risk-Based Capital Ratio | 17.08 | % | 17.09 | % |
Total Risk-Based Capital Ratio | 18.33 | % | 18.34 | % |
Tier 1 Leverage Ratio | 12.08 | % | 11.28 | % |
OTHER DATA | ||||
Full Time Equivalent | ||||
Employees (FTE's) | 34 | 28 | ||
Stock Price Range | ||||
(For the Three Months Ended): | ||||
High | $ | 104.51 | $ | 91.00 |
Low | $ | 91.50 | $ | 80.00 |
Close | $ | 93.00 | $ | 91.00 |
SOURCE: Trinity Bank, NA (Fort Worth, Texas)
View the original press release on ACCESS Newswire
F.Wilson--AT