
Pampa Energía Announces Second Quarter 2025 Results: Shale Oil Ramp-up, Gas Production Record
 UK'S King Charles breaks precedent to reveal £30 mn paid in taxes since 2022

 Yoon grabs early Women's PGA Championship lead with Korda in hunt

 Will Taylor Swift and Travis Kelce wed in New York? Clues abound

 Lawyer says Vondrousova 'should appeal' against four-year ban

 Hospitals raise alert as heatwave slams Europe

 'Alligator Alcatraz' detention center shuts in US: official

 Tennis great Evert says 'relentless' cancer has returned

 Colombian president-elect gives armed groups one month to surrender

 New Zealand's Latham and Conway pile on the runs before Stokes breakthrough

 Dominant Osaka sails into Bad Homburg semis

 US Supreme Court says asylum seekers can be turned away before border

 Olivia Wilde looks at evolving relationships in 'The Invite'

 Rows, drones and 'sorry' Son as South Korea await World Cup fate

 Antonelli welcomes Mercedes upgrade as Russell says beware Hamilton

 Antonelli welcomes Mercedes upgrade ast Russell says beware Hamilton

 HRW denounces Turkey arrests ahead of NATO summit

 Alonso committed to Aston Martin, but is keeping options open

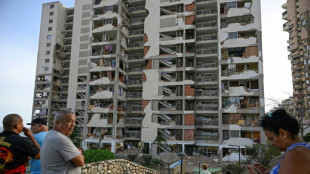
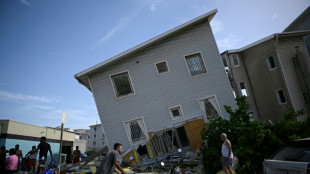 Venezuelans trapped alive after twin quakes kill at least 164

 New Zealand make England toil as Stokes returns for series decider

 Americans impacted by climate change demand answers from lawmakers

 Heat-struck Italians cool off in ancient stone 'trulli'

 French teaching unions call strike over 'unacceptable' heat

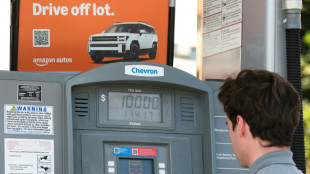 US Fed's preferred inflation gauge hits fresh three-year high
 Dominant Osaka cruises into Bad Homburg semis

 New Zealand frustrate England as Stokes returns for series decider

BUENOS AIRES, ARGENTINA / ACCESS Newswire / August 6, 2025 / Pampa Energía S.A. (NYSE:PAM)(Buenos Aires Stock Exchange:PAMP), an independent company with active participation in Argentine oil, gas and electricity, announces the results for the six-month period and quarter ended on June 30, 2025.
Pampa reports its financial information in US$, its functional currency. For local currency equivalents, transactional exchange rate ('FX') is applied. However, Transener and Transportadora de Gas del Sur's ('TGS') figures are adjusted for inflation as of June 30, 2025, and converted into US$ using the period-end FX. Previously reported figures remained unchanged.
Second quarter 2025 ('Q2 25') main results1
Sales recorded US$486 million in US$486 million in Q2 252, a 3% year-on-year slight decline, driven by lower deliveries under the Plan Gas Long-term gas sale agreement ('GSA') and a drop in petrochemical and crude oil prices, partially offset by contributions from Parque Eólico Pampa Energía 6 ('PEPE 6'), higher spot energy prices and increased export volumes of gas, crude and reformer products.
During Q2 25, oil production rose at Rincón de Aranda and wind power generation achieved a high load factor.
Pampa's main operational KPIs | Q2 25 | Q2 24 | Variation | ||
Oil and gas | Production (k boe/day) | 84.1 | 90.8 | -7 | % |
Gas production (kboepd) | 76.1 | 85.4 | -11 | % | |
Crude oil production (kbpd) | 8.0 | 5.4 | +47 | % | |
Average gas price (US$/MBTU) | 4.0 | 4.0 | -1 | % | |
Average oil price (US$/bbl) | 61.6 | 71.8 | -14 | % | |
Power | Generation (GWh) | 4,704 | 5,067 | -7 | % |
Gross margin (US$/MWh) | 25.8 | 24.7 | +5 | % | |
Petrochemicals | Volume sold (k ton) | 125 | 111 | +12 | % |
Average price (US$/ton) | 978 | 1,199 | -18 | % | |
Adjusted EBITDA reached US$239 million in Q2 25, 17% less than Q2 24, explained by lower gas deliveries under Plan Gas and weaker domestic demand, a decline in petrochemical prices and higher operating expenses, partially offset by higher spot prices, PEPE 6 and increased oil output and gas exports.
Net income attributable to shareholders was US$40 million, 60% decrease year-on-year3, mainly explained by higher non-cash deferred tax charges and a lower operating margin, offset by gains from holding financial instruments and the absence of impairments recorded on Q2 24.
Net debt totaled US$712 million, representing a net-debt to EBITDA ratio of 1.1x, mainly due to higher working capital needs and continued investments in the development of Rincón de Aranda.
1 The information is based on financial statements ('FS') prepared according to International Financial Reporting Standards ('IFRS') in force in Argentina.
2 Sales from the affiliates CTBSA, Transener and TGS are excluded, shown as 'Results for participation in joint businesses and associates.'
3 Consolidated adjusted EBITDA represents the flows before financial items, income tax, depreciations and amortizations, extraordinary and non-cash income and expense, equity income, and includes affiliates' EBITDA at our ownership. Further information on section 3.1.
Consolidated balance sheet
(As of June 30, 2025 and December 2024, in millions)
As of 06.30.2025 | As of 12.31.2024 | |||||||||||
Figures in million | AR$ | US$ | AR$ | US$ | ||||||||
ASSETS | ||||||||||||
Property, plant and equipment | 3,519,259 | 2,921 | 2,690,533 | 2,607 | ||||||||
Intangible assets | 111,806 | 92 | 99,170 | 95 | ||||||||
Right-of-use assets | 11,481 | 10 | 11,330 | 11 | ||||||||
Deferred tax asset | 139,295 | 116 | 161,694 | 157 | ||||||||
Investments in associates and joint ventures | 1,274,813 | 1,058 | 1,024,769 | 993 | ||||||||
Financial assets at amortized cost | - | - | - | - | ||||||||
Financial assets at fair value through profit and loss | 32,842 | 27 | 28,127 | 27 | ||||||||
Other assets | 436 | - | 366 | - | ||||||||
Trade and other receivables | 166,569 | 139 | 76,798 | 75 | ||||||||
Total non-current assets | 5,256,501 | 4,363 | 4,092,787 | 3,965 | ||||||||
Inventories | 294,050 | 244 | 230,095 | 223 | ||||||||
Financial assets at amortized cost | 51,012 | 42 | 82,628 | 80 | ||||||||
Financial assets at fair value through profit and loss | 814,863 | 676 | 877,623 | 850 | ||||||||
Derivative financial instruments | 45,748 | 38 | 979 | 1 | ||||||||
Trade and other receivables | 720,687 | 598 | 503,529 | 488 | ||||||||
Cash and cash equivalents | 193,570 | 161 | 761,231 | 738 | ||||||||
Total current assets | 2,119,930 | 1,759 | 2,456,085 | 2,380 | ||||||||
Total assets | 7,376,431 | 6,122 | 6,548,872 | 6,345 | ||||||||
EQUITY | ||||||||||||
Equity attributable to owners of the company | 4,199,021 | 3,485 | 3,391,127 | 3,286 | ||||||||
Non-controlling interest | 10,344 | 9 | 9,167 | 9 | ||||||||
Total equity | 4,209,365 | 3,494 | 3,400,294 | 3,295 | ||||||||
LIABILITIES | ||||||||||||
Provisions | 125,411 | 104 | 141,436 | 137 | ||||||||
Income tax and minimum notional income tax provision | 411,483 | 341 | 77,284 | 75 | ||||||||
Deferred tax liability | 58,729 | 49 | 50,223 | 49 | ||||||||
Defined benefit plans | 36,817 | 31 | 31,293 | 30 | ||||||||
Borrowings | 1,650,036 | 1,369 | 1,416,917 | 1,373 | ||||||||
Trade and other payables | 99,868 | 83 | 87,992 | 84 | ||||||||
Total non-current liabilities | 2,382,344 | 1,977 | 1,805,145 | 1,748 | ||||||||
Provisions | 10,215 | 8 | 10,725 | 10 | ||||||||
Income tax liability | 19,732 | 16 | 265,008 | 257 | ||||||||
Tax liabilities | 43,865 | 36 | 30,989 | 30 | ||||||||
Defined benefit plans | 6,942 | 6 | 7,077 | 7 | ||||||||
Salaries and social security payable | 28,461 | 24 | 40,035 | 39 | ||||||||
Derivative financial instruments | 2 | - | 2 | - | ||||||||
Borrowings | 267,715 | 222 | 728,096 | 706 | ||||||||
Trade and other payables | 407,790 | 339 | 261,501 | 253 | ||||||||
Total current liabilities | 784,722 | 651 | 1,343,433 | 1,302 | ||||||||
Total liabilities | 3,167,066 | 2,628 | 3,148,578 | 3,050 | ||||||||
Total liabilities and equity | 7,376,431 | 6,122 | 6,548,872 | 6,345 | ||||||||
Consolidated income statement
(For the six-month periods and quarters ended on June 30, 2025 and 2024, in millions)
First half | Second quarter | |||||||||||||||||||||||||||
Figures in million | 2025 | 2024 | 2025 | 2024 | ||||||||||||||||||||||||
AR$ | US$ | AR$ | US$ | AR$ | US$ | AR$ | US$ | |||||||||||||||||||||
Sales revenue | 1,008,884 | 900 | 783,788 | 901 | 570,169 | 486 | 446,412 | 500 | ||||||||||||||||||||
Domestic sales | 839,685 | 750 | 649,186 | 742 | 466,791 | 398 | 374,607 | 416 | ||||||||||||||||||||
Foreign market sales | 169,199 | 150 | 134,602 | 159 | 103,378 | 88 | 71,805 | 84 | ||||||||||||||||||||
Cost of sales | (700,707 | ) | (625 | ) | (487,428 | ) | (565 | ) | (399,697 | ) | (340 | ) | (272,245 | ) | (307 | ) | ||||||||||||
Gross profit | 308,177 | 275 | 296,360 | 336 | 170,472 | 146 | 174,167 | 193 | ||||||||||||||||||||
Selling expenses | (47,845 | ) | (43 | ) | (31,582 | ) | (36 | ) | (25,355 | ) | (22 | ) | (18,002 | ) | (20 | ) | ||||||||||||
Administrative expenses | (93,701 | ) | (84 | ) | (71,674 | ) | (83 | ) | (48,646 | ) | (41 | ) | (37,436 | ) | (42 | ) | ||||||||||||
Exploration expenses | (225 | ) | - | (167 | ) | - | (167 | ) | - | (85 | ) | - | ||||||||||||||||
Other operating income | 60,181 | 53 | 70,781 | 83 | 24,708 | 21 | 41,789 | 48 | ||||||||||||||||||||
Other operating expenses | (44,759 | ) | (40 | ) | (43,054 | ) | (52 | ) | (21,048 | ) | (18 | ) | (16,669 | ) | (21 | ) | ||||||||||||
Impairment on PPE, int. assets & inventories | (776 | ) | (1 | ) | (142 | ) | - | 31 | (1 | ) | (110 | ) | - | |||||||||||||||
Impairment of financial assets | (2,508 | ) | (2 | ) | (49,592 | ) | (56 | ) | (2,296 | ) | (2 | ) | (19,762 | ) | (22 | ) | ||||||||||||
Results for part. in joint businesses & associates | 91,347 | 76 | 31,894 | 39 | 43,203 | 30 | (19,522 | ) | (22 | ) | ||||||||||||||||||
Income from the sale of associates | - | - | 5,765 | 7 | - | - | 4,307 | 5 | ||||||||||||||||||||
Operating income | 269,891 | 234 | 208,589 | 238 | 140,902 | 113 | 108,677 | 119 | ||||||||||||||||||||
Financial income | 38,744 | 35 | 2,009 | 2 | 3,250 | 2 | 662 | - | ||||||||||||||||||||
Financial costs | (111,459 | ) | (99 | ) | (81,688 | ) | (94 | ) | (68,615 | ) | (58 | ) | (37,733 | ) | (41 | ) | ||||||||||||
Other financial results | 138,110 | 122 | 62,861 | 74 | 100,060 | 85 | 19,056 | 22 | ||||||||||||||||||||
Financial results, net | 65,395 | 58 | (16,818 | ) | (18 | ) | 34,695 | 29 | (18,015 | ) | (19 | ) | ||||||||||||||||
Profit before tax | 335,286 | 292 | 191,771 | 220 | 175,597 | 142 | 90,662 | 100 | ||||||||||||||||||||
Income tax | (115,125 | ) | (99 | ) | 121,166 | 147 | (118,154 | ) | (103 | ) | (1,521 | ) | (1 | ) | ||||||||||||||
Net income for the period | 220,161 | 193 | 312,937 | 367 | 57,443 | 39 | 89,141 | 99 | ||||||||||||||||||||
Attributable to the owners of the Company | 220,570 | 193 | 313,160 | 367 | 58,684 | 40 | 90,061 | 100 | ||||||||||||||||||||
Attributable to the non-controlling interest | (409 | ) | - | (223 | ) | - | (1,241 | ) | (1.0 | ) | (920 | ) | (1 | ) | ||||||||||||||
Net income per share to shareholders | 162.2 | 0.1 | 230.3 | 0.3 | 43.2 | 0.0 | 66.2 | 0.1 | ||||||||||||||||||||
Net income per ADR to shareholders | 4,054.6 | 3.5 | 5,756.6 | 6.7 | 1,078.8 | 0.7 | 1,655.5 | 1.8 | ||||||||||||||||||||
Average outstanding common shares1 | 1,360 | 1,360 | 1,360 | 1,360 | ||||||||||||||||||||||||
Outstanding shares by the end of period1 | 1,360 | 1,360 | 1,360 | 1,360 | ||||||||||||||||||||||||
Note: 1 It considers the Employee stock-based compensation plan shares, which amounted to 3.9 million common shares as of June 30, 2024 and 2025.
Consolidated cash flow statement
(For the six-month periods ended on June 30, 2025 and 2024, in millions)
First half 2025 | First half 2024 | |||||||||||
Figures in millions | AR$ | US$ | AR$ | US$ | ||||||||
OPERATING ACTIVITIES | ||||||||||||
Profit of the period | 220,161 | 193 | 312,937 | 367 | ||||||||
Adjustments to reconcile net profit to cash flows from operating activities | 170,306 | 163 | 52,945 | 47 | ||||||||
Changes in operating assets and liabilities | (267,928 | ) | (209 | ) | (294,654 | ) | (350 | ) | ||||
Increase in trade receivables and other receivables | (310,052 | ) | (254 | ) | (369,488 | ) | (432 | ) | ||||
Increase in inventories | (23,792 | ) | (20 | ) | (24,392 | ) | (30 | ) | ||||
Increase in trade and other payables | 66,873 | 65 | 71,280 | 81 | ||||||||
(Decrease) Increase in salaries and social security payables | (11,709 | ) | (10 | ) | 3,122 | 3 | ||||||
Defined benefit plans payments | (1,314 | ) | (1 | ) | (1,074 | ) | (1 | ) | ||||
Increase in tax liabilities | 13,739 | 13 | 26,664 | 30 | ||||||||
Decrease in provisions | (4,245 | ) | (4 | ) | (916 | ) | (1 | ) | ||||
Collection for derivative financial instruments, net | 2,572 | 2 | 150 | - | ||||||||
Net cash generated by (used in) operating activities | 122,539 | 147 | 71,228 | 64 | ||||||||
INVESTING ACTIVITIES | ||||||||||||
Payment for property, plant and equipment acquisitions | (473,948 | ) | (444 | ) | (216,377 | ) | (260 | ) | ||||
Payment for intangible assets acquisitions | - | - | (2,457 | ) | (3 | ) | ||||||
Collection for sales of public securities and shares, net | 350,106 | 316 | 32,883 | 86 | ||||||||
Subscription of mutual funds, net | (4,906 | ) | (4 | ) | (755 | ) | (1 | ) | ||||
Capital integration in companies | (44,726 | ) | (41 | ) | (19,750 | ) | (23 | ) | ||||
Payment for right-of-use | - | - | (11,192 | ) | (13 | ) | ||||||
Collection for equity interests in companies sales | - | - | 15,802 | 18 | ||||||||
Collection for joint ventures?? share repurchase | - | - | 30,138 | 37 | ||||||||
Collections for intangible assets sales | 4,608 | 3 | - | - | ||||||||
Dividends collection | 4 | - | 6,955 | 8 | ||||||||
Collection for equity interests in areas sales | 2,410 | 2 | - | - | ||||||||
Collection (Payment) of loans | - | - | (115 | ) | - | |||||||
Net cash generated by (used in) investing activities | (166,452 | ) | (168 | ) | (164,868 | ) | (151 | ) | ||||
FINANCING ACTIVITIES | ||||||||||||
Proceeds from borrowings | 434,160 | 380 | 265,785 | 306 | ||||||||
Payment of borrowings | (115,152 | ) | (108 | ) | (60,169 | ) | (69 | ) | ||||
Payment of borrowings interests | (113,675 | ) | (101 | ) | (71,365 | ) | (83 | ) | ||||
Repurchase and redemption of corporate bonds | (804,524 | ) | (725 | ) | (66,329 | ) | (75 | ) | ||||
Payments of dividends | - | - | (37 | ) | - | |||||||
Payments of leases | (2,035 | ) | (2 | ) | (1,564 | ) | (2 | ) | ||||
Net cash (used in) generated by financing activities | (601,226 | ) | (556 | ) | 66,321 | 77 | ||||||
(Decrease) Increase in cash and cash equivalents | (645,139 | ) | (577 | ) | (27,319 | ) | (10 | ) | ||||
Cash and cash equivalents at the beginning of the year | 761,231 | 738 | 137,973 | 171 | ||||||||
Exchange difference generated by cash and cash equivalents | 77,487 | n.a. | 27,860 | n.a. | ||||||||
Decrease in cash and cash equivalents | (645,139 | ) | (577 | ) | (27,319 | ) | (10 | ) | ||||
Cash and cash equivalents at the end of the period | 193,570 | 161 | 138,514 | 161 | ||||||||
For the full version of the Earnings Report, please visit Pampa's Investor Relations website: ri.pampa.com/en.
Information about the videoconference
There will be a videoconference to discuss Pampa's Q2 25 results on Thursday, August 7, 2025, at 10:00 a.m. Eastern Standard Time/11:00 a.m. Buenos Aires Time. The hosts will be Gustavo Mariani, CEO, Adolfo Zuberbühler, CFO, Horacio Turri, EVP and head of oil and gas and Lida Wang, IR & ESG Officer at Pampa.
For those interested in participating, please register here.
For further information about Pampa:
SOURCE: 1/3 Pampa Energía S.A.
View the original press release on ACCESS Newswire
N.Mitchell--AT