Jerash Holdings Reports Fiscal 2026 Second Quarter Financial Results
 French TV presenter stood down over Doku World Cup comments

 Messi sets World Cup scoring record with 17th goal

 Colombian leftist candidate calls for calm after post-vote violence

 Britons cautiously optimistic after PM's resignation

 Draper makes winning return at Eastbourne with Murray on his side

 Argentina fans defiant, 40 years on from Maradona's 'Hand of God'
 Wikipedia won't let AI edit articles, cofounder says

 Uncapped Coles named in England's T20 squad to face India

 Andy Burnham: 'King of the North' eyes Downing Street throne

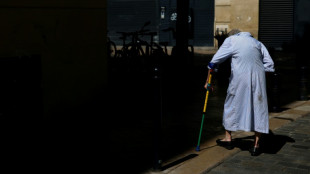
 Dangerous 'heat stress' has surged worldwide, study shows

 Interstellar comet likely far older than Solar System: astronomers

 Man Utd secure land for proposed new 100,000-capacity stadium

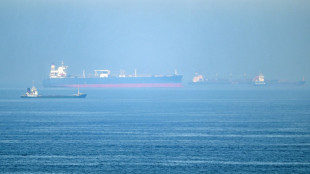
 US suspends Iran oil sanctions, says nuclear inspectors to return

 Stokes and Atkinson cleared by Cricket Regulator after nightclub incident

 Veteran Le Roy named new coach of Congo

 Germany's Schlotterbeck out of World Cup with ankle injury

 Vance hails 'good foundation' for Iran deal after direct talks

 Leinster boss Cullen to step down at end of next season

 Oil falls on US-Iran progress; pound holds up as Starmer resigns

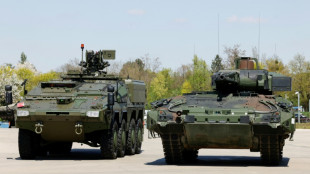 France, Germany reach deal on arms maker KNDS, paving way for IPO
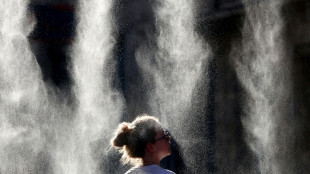
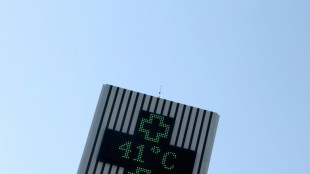
 France set for hottest day yet of heatwave

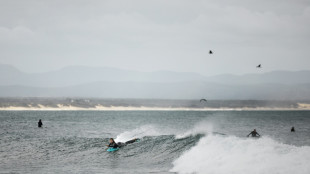
 Gaza's surfers seek solace in the sea

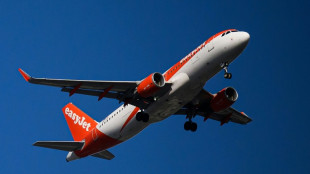 EasyJet rejects £5 bn takeover offer from US equity firm
 Mediators hail 'progress' in US-Iran talks after lengthy opening session

 Coffee break: Starbucks Korea stores pause for training after 'Tank Day' fiasco

FAIRFIELD, NEW JERSEY / ACCESS Newswire / November 12, 2025 / Jerash Holdings (US), Inc. (NASDAQ:JRSH) (the "Company" or "Jerash"), which manufactures and exports custom, ready-made, sportswear and outerwear for leading global brands, today announced financial results for its fiscal 2026 second quarter ended September 30, 2025.
Fiscal 2026 Second Quarter Highlights
Revenue increased 4.3 percent to $42.0 million, from $40.2 million in the prior year quarter.
Gross margin was 15.0 percent, compared with 17.5 percent in the prior year quarter.
Operating income was $1.09 million, compared with $1.13 million in the prior year quarter.
Net income was $479,000, compared with $665,000 in the prior year quarter.
Outlook
Revenue for the fiscal 2026 third quarter is expected to increase by 19 to 21 percent over the same quarter last year.
Gross margin goal for the fiscal 2026 third quarter is approximately 13 to 15 percent.
"Amid ongoing trade uncertainties, we continue to experience growing demand from our customers, as Jordan is increasingly becoming a preferred destination for global brands seeking to diversify their manufacturing partnerships beyond Asia," said Sam Choi, Jerash's chairman and chief executive officer.
"In late June, we completed an expansion of our existing manufacturing facilities, adding approximately 15 percent to our much-needed production capacity. With increasing capacity requests from our global customers and strategic partners, we have initiated a long-term expansion plan to support anticipated growth. This includes exploring potential acquisitions and facility development on our own land to ensure that Jerash remains well-positioned to sustain our competitive edge and meet evolving market demands.
"Gross margin for the quarter was lower than that for the same period last year, which benefited from catch-up production of higher-margin outerwear originally scheduled for the first quarter of fiscal 2025. Additionally, as we successfully continue to diversify our customer base and product mix, we expect a slightly lower average gross margin in the near term. As order volumes for our expanded product offerings continue to scale, our goal is to improve gross profit margins through increased production automation and the benefits of economies of scale.
"During this important period of progress for the Company, we remain attentive to potential impacts of geopolitical uncertainties in the region and evolving tariff developments as we continue advancing our growth strategy," Choi added.
Fiscal 2026 Second Quarter Results
Revenue for the fiscal 2026 second quarter grew 4.3 percent to $42.0 million, from $40.2 million in the same quarter last year. The increase was primarily driven an increase in shipments to the U.S., resulting from a more diverse customer base in fiscal 2026.
Gross profit was $6.3 million for the fiscal 2026 second quarter, compared with $7.1 million in the same quarter last year. Gross profit margin for the quarter declined to 15.0 percent, from 17.5 percent in the same period last year, which benefited from catch-up production of some outerwear that carried higher margins originally scheduled for the first quarter of fiscal 2025. The decrease was primarily driven by the diversification of customer base and product mix, which resulted in a lower average gross margin.
Operating expenses totaled $5.2 million in the fiscal 2026 second quarter, compared with $5.9 million in the same quarter last year. The decrease was primarily due to better control of export costs and lower stock-based compensation expenses.
Operating income was $1.09 million in the fiscal 2026 second quarter, slightly lower than $1.13 million in the same quarter last year.
Total other expenses were $456,000 in the fiscal 2026 second quarter, compared with $364,000 in the same quarter last year. The increase was primarily due to the increase in financing needs to support business growth.
Income tax expenses were $154,000 in the fiscal 2026 second quarter, compared with $106,000 in the prior year quarter.
Net income was $479,000, or $0.04 per diluted share, in the fiscal 2026 second quarter, compared with $665,000, or $0.05 per diluted share, in the same quarter last year.
Comprehensive income attributable to the Company's common stockholders totaled $444,000 in the fiscal 2026 second quarter, compared with $663,000 in the same quarter last year.
Six-Month Fiscal Year 2026 Results
Revenue for the first six months of fiscal year 2026 rose to $81.6 million, from $81.2 million in the same period last year. The increase was mainly due to the increase in overall demands for most of Jerash's major customers following the Company's efforts to diversify customer base.
Gross profit increased 5.8 percent to $12.4 million for the first half of fiscal year 2026, compared with $11.7 million for the same period last year. Gross margin for the first six months of fiscal year 2026 increased to 15.2 percent, compared with 14.4 percent in the same period last year.
Operating expenses for the first six months of fiscal year 2026 were $10.3 million, compared with $11.4 million for the same period last year. Operating income increased to $2.0 million for the first six months of fiscal year 2026, compared with $306,000 for the same period last year. The improvement was mainly attributable to reduced export logistics costs, lower stock-based compensation expenses, and reduced spending on repairs and maintenance.
Total other expenses for the first six months of fiscal 2026 decreased to $763,000, compared with $790,000 for the same period last year, primarily due to lower interest expense.
Income tax expenses were $483,000 for the first six months of fiscal year 2026, compared with $218,000 for the same period in prior year.
Net income for the first six months of fiscal year 2026 was $803,000, or $0.06 per diluted share, compared with a net loss of $702,000, or $0.06 per share, in the same period last year. The increase was primarily driven by greater overall demand, improved control over import and export costs, and business growth that enabled lower average costs through economies of scale.
Comprehensive income attributable to Jerash's common stockholders was $773,000 in the first six months of fiscal year 2026, compared with comprehensive loss of $673,000 for the same period last year.
Balance Sheet, Cash Flow, and Dividends
Cash and restricted cash totaled $13.7 million, and net working capital was $35.2 million as of September 30, 2025.
On November 7, 2025, Jerash's board of directors approved a regular quarterly dividend of $0.05 per share on its common stock, payable on November 26, 2025 to stockholders of record as of November 19, 2025.
Conference Call
Jerash Holdings will host an investor conference call to discuss its fiscal 2026 second quarter results today, November 12, 2025, at 9:00 a.m. Eastern Time.
Phone: 888-506-0062 (domestic); 973-528-0011 (international)
Conference ID: 589743
A live and archived webcast will be available online in the investor relations section of Jerash's website at www.jerashholdings.com. For those who are not able to listen to the live broadcast, the call will be archived for approximately one year on the website.
About Jerash Holdings (US), Inc.
Jerash Holdings (US), Inc. manufactures and exports custom, ready-made, sportswear and outerwear for leading global brands and retailers, including VF Corporation (which owns brands such as The North Face, Timberland, and Vans), New Balance, G-III (which licenses brands such as DKNY and Nautica), Acushnet Holdings Corp (which owns the brand FootJoy), American Eagle, and Skechers. Jerash's existing production facilities comprise six factory units and four warehouses, and Jerash currently employs approximately 6,000 people. Additional information is available at www.jerashholdings.com.
Forward-Looking Statements
This news release contains forward-looking statements that involve risks and uncertainties, which may cause actual results to differ materially from the statements made. When used in this document, the words "may", "would", "could", "will", "intend", "plan", "anticipate", "believe", "estimate", "expect", "seek", "potential," "outlook" and similar expressions are intended to identify forward-looking statements. Such statements, including, but not limited to, Jerash's current views with respect to future events and its financial forecasts, and expansion of the customer base among high-profile global brands, are subject to such risks and uncertainties. Many factors could cause actual results to differ materially from the statements made, including those risks described from time to time in filings made by Jerash with the U.S. Securities and Exchange Commission. These and other risks and uncertainties are detailed in the Company's filings with the U.S. Securities and Exchange Commission. Should one or more of these risks or uncertainties materialize, or should assumptions underlying the forward-looking statements prove incorrect, actual results may vary materially from those described herein as intended, planned, anticipated or expected. Statements contained in this news release regarding past trends or activities should not be taken as a representation that such trends or activities will continue in the future. Jerash does not intend and does not assume any obligation to update these forward-looking statements, other than as required by law.
Contact:
PondelWilkinson Inc.
Judy Lin or Roger Pondel
310-279-5980; [email protected]
# # #
(tables below)
JERASH HOLDINGS (US), INC., AND SUBSIDIARIES
CONDENSED CONSOLIDATED STATEMENTS OF OPERATIONS AND COMPREHENSIVE INCOME (LOSS) (Unaudited)
For the Three Months Ended | For the Six Months Ended September 30, | |||||||||||
2025 | 2024 | 2025 | 2024 | |||||||||
Revenue, net | $ | 41,968,534 | $ | 40,240,127 | $ | 81,597,842 | $ | 81,175,843 | ||||
Cost of goods sold | 35,678,854 | 33,182,244 | 69,219,282 | 69,478,089 | ||||||||
Gross Profit | 6,289,680 | 7,057,883 | 12,378,560 | 11,697,754 | ||||||||
Selling, general, and administrative expenses | 4,971,466 | 5,449,386 | 9,878,681 | 10,449,130 | ||||||||
Stock-based compensation expenses | 228,826 | 474,088 | 451,495 | 943,023 | ||||||||
Total Operating Expenses | 5,200,292 | 5,923,474 | 10,330,176 | 11,392,153 | ||||||||
Income from Operations | 1,089,388 | 1,134,409 | 2,048,384 | 305,601 | ||||||||
Other Income (Expenses): | ||||||||||||
Interest expenses | (493,482 | ) | (503,149 | ) | (849,330 | ) | (983,352 | ) | ||||
Other income, net | 37,153 | 139,166 | 86,467 | 193,201 | ||||||||
Total other expenses, net | (456,329 | ) | (363,983 | ) | (762,863 | ) | (790,151 | ) | ||||
Net income (loss) before provision for income taxes | 633,059 | 770,426 | 1,285,521 | (484,550 | ) | |||||||
Income tax expenses | 153,756 | 105,877 | 482,588 | 217,598 | ||||||||
Net income (loss) | 479,303 | 664,549 | 802,933 | (702,148 | ) | |||||||
Net (gain) loss attributable to noncontrolling interest | (17,698 | ) | (9,261 | ) | (22,652 | ) | 12,220 | |||||
Net income (loss) attributable to Jerash Holdings (US), Inc.'s Common Stockholders | $ | 461,605 | $ | 655,288 | $ | 780,281 | $ | (689,928 | ) | |||
Net income (loss) | $ | 479,303 | $ | 664,549 | $ | 802,933 | $ | (702,148 | ) | |||
Other Comprehensive Income (Loss): | ||||||||||||
Foreign currency translation (loss) gain | (17,215 | ) | 7,583 | (7,651 | ) | 16,496 | ||||||
Total Comprehensive Income (Loss) | 462,088 | 672,132 | 795,282 | (685,652 | ) | |||||||
Comprehensive (income) loss attributable to noncontrolling interest | (17,698 | ) | (9,261 | ) | (22,652 | ) | 12,220 | |||||
Comprehensive Income (Loss) Attributable to Jerash Holdings (US), Inc.'s Common Stockholders | $ | 444,390 | $ | 662,871 | $ | 772,630 | $ | (673,432 | ) | |||
Earnings (Loss) Per Share Attributable to Common Stockholders: | ||||||||||||
Basic and diluted | $ | 0.04 | $ | 0.05 | $ | 0.06 | $ | (0.06 | ) | |||
Weighted Average Number of Shares | ||||||||||||
Basic | 12,699,940 | 12,294,840 | 12,699,940 | 12,294,840 | ||||||||
Diluted | 13,174,524 | 12,460,241 | 13,125,459 | 12,294,840 | ||||||||
Dividend per share | $ | 0.05 | $ | 0.05 | $ | 0.10 | $ | 0.10 | ||||
JERASH HOLDINGS (US), INC. AND SUBSIDIARIES
CONDENSED CONSOLIDATED BALANCE SHEETS
September 30, | March 31, | |||||||||
(Unaudited) | ||||||||||
ASSETS | ||||||||||
Current Assets: | ||||||||||
Cash | $ | 12,002,314 | $ | 13,346,791 | ||||||
Accounts receivable, net | 5,798,578 | 3,076,074 | ||||||||
Inventories | 26,256,890 | 27,704,829 | ||||||||
Prepaid expenses and other current assets | 3,500,397 | 3,648,321 | ||||||||
Advance to suppliers, net | 7,995,085 | 6,644,194 | ||||||||
Total Current Assets | 55,553,264 | 54,420,209 | ||||||||
Restricted cash - non-current | 1,700,539 | 1,717,248 | ||||||||
Long-term deposits | 379,283 | 464,934 | ||||||||
Property, plant, and equipment, net | 24,667,532 | 25,023,681 | ||||||||
Goodwill | 499,282 | 499,282 | ||||||||
Operating lease right of use assets | 535,512 | 850,172 | ||||||||
Total Assets | $ | 83,335,412 | $ | 82,975,526 | ||||||
LIABILITIES AND EQUITY | ||||||||||
Current Liabilities: | ||||||||||
Credit facilities | $ | 5,176,438 | $ | 4,512,462 | ||||||
Accounts payable | 7,755,534 | 6,507,308 | ||||||||
Accrued expenses | 4,075,252 | 4,342,436 | ||||||||
Income tax payable - current | 865,161 | 1,305,386 | ||||||||
Uncertain tax provision | - | 175,290 | ||||||||
Other payables | 1,502,010 | 2,149,185 | ||||||||
Deferred revenue | 691,264 | 487,004 | ||||||||
Operating lease liabilities - current | 314,685 | 339,699 | ||||||||
Total Current Liabilities | 20,380,344 | 19,818,770 | ||||||||
Deferred tax liabilities, net | 120 | 120 | ||||||||
Operating lease liabilities - non-current | 109,056 | 287,527 | ||||||||
Total Liabilities | 20,489,520 | 20,106,417 | ||||||||
Equity | ||||||||||
Preferred stock, $0.001 par value; 500,000 shares authorized; none issued and outstanding | $ | - | $ | - | ||||||
Common stock, $0.001 par value; 30,000,000 shares authorized; 12,939,418 shares issued, and 12,699,940 shares outstanding as of September 30, 2025 and March 31, 2025, respectively | 12,939 | 12,939 | ||||||||
Additional paid-in capital | 26,126,330 | 25,674,835 | ||||||||
Treasury stock, 239,478 shares | (1,169,046 | ) | (1,169,046 | ) | ||||||
Statutory reserve | 413,821 | 413,821 | ||||||||
Retained earnings | 37,907,188 | 38,396,901 | ||||||||
Accumulated other comprehensive loss | (520,773 | ) | (513,122 | ) | ||||||
Total Jerash Holdings (US), Inc. Stockholders' Equity | 62,770,459 | 62,816,328 | ||||||||
Noncontrolling interest | 75,433 | 52,781 | ||||||||
Total Equity | 62,845,892 | 62,869,109 | ||||||||
Total Liabilities and Equity | $ | 83,335,412 | $ | 82,975,526 | ||||||
JERASH HOLDINGS (US), INC. AND SUBSIDIARIES
CONDENSED CONSOLIDATED STATEMENTS OF CASH FLOWS
(Unaudited)
For the Six Months Ended September 30, | ||||||
2025 | 2024 | |||||
CASH FLOWS FROM OPERATING ACTIVITIES | ||||||
Net income (loss) | $ | 802,933 | $ | (702,148 | ) | |
Adjustments to reconcile net income (loss) to net cash provided by operating activities: | ||||||
Depreciation | 1,506,793 | 1,209,053 | ||||
Stock-based compensation expenses | 451,495 | 943,023 | ||||
Credit loss | - | 16,768 | ||||
Amortization of operating lease right-of-use assets | 316,722 | 300,559 | ||||
Changes in operating assets: | ||||||
Accounts receivable | (2,722,504 | ) | (392,484 | ) | ||
Inventories | 1,447,940 | 7,034,774 | ||||
Prepaid expenses and other current assets | 147,924 | (470,777 | ) | |||
Advance to suppliers | (1,350,891 | ) | (2,942,296 | ) | ||
Changes in operating liabilities: | ||||||
Accounts payable | 1,248,225 | (1,945,505 | ) | |||
Accrued expenses | (267,184 | ) | (520,948 | ) | ||
Other payables | (647,175 | ) | 133,937 | |||
Deferred revenue | 204,260 | 1,112,963 | ||||
Operating lease liabilities | (205,547 | ) | (238,237 | ) | ||
Income tax payable | (614,713 | ) | (1,112,062 | ) | ||
Net cash provided by operating activities | 318,278 | 2,426,620 | ||||
CASH FLOWS FROM INVESTING ACTIVITIES | ||||||
Purchases of property, plant, and equipment | (844,401 | ) | (348,238 | ) | ||
Payments for construction of properties | - | (270,599 | ) | |||
Payment for long-term deposits | (209,543 | ) | (317,386 | ) | ||
Net cash used in investing activities | (1,053,944 | ) | (936,223 | ) | ||
CASH FLOWS FROM FINANCING ACTIVITIES | ||||||
Dividend payment | (1,269,994 | ) | (1,229,484 | ) | ||
Repayment from short-term loan | (10,003,284 | ) | (5,566,040 | ) | ||
Proceeds from short-term loan | 10,667,260 | 9,136,277 | ||||
Net cash (used in) provided by financing activities | (606,018 | ) | 2,340,753 | |||
EFFECT OF EXCHANGE RATE CHANGES ON CASH AND RESTRICTED CASH | (19,502 | ) | 16,018 | |||
NET (DECREASE) INCREASE IN CASH AND RESTRICTED CASH | (1,361,186 | ) | 3,847,168 | |||
CASH, AND RESTRICTED CASH, BEGINNING OF THE PERIOD | 15,064,039 | 14,036,867 | ||||
CASH, AND RESTRICTED CASH, END OF THE PERIOD | $ | 13,702,853 | $ | 17,884,035 | ||
CASH, AND RESTRICTED CASH, END OF THE PERIOD | $ | 13,702,853 | $ | 17,884,035 | ||
LESS: NON-CURRENT RESTRICTED CASH | 1,700,539 | 1,545,457 | ||||
CASH, END OF THE PERIOD | $ | 12,002,314 | $ | 16,338,578 | ||
Supplemental disclosure information: | ||||||
Cash paid for interest | $ | 849,330 | $ | 983,352 | ||
Income tax paid | $ | 1,105,128 | $ | 1,329,150 | ||
Non-cash investing and financing activities | ||||||
Equipment obtained by utilizing long-term deposit | $ | 295,195 | $ | 262,017 | ||
Operating lease right of use assets obtained in exchange for operating lease obligations | $ | - | $ | 67,512 | ||
SOURCE: Jerash Holdings (US), Inc.
View the original press release on ACCESS Newswire
H.Romero--AT