
Zedge Reports Third Quarter Fiscal 2026 Results

 Lula, Bolsonaro in final push for votes ahead of knife-edge election

 Boisterous fashion week barnstorms 'sleepy' Nigerian capital

 UAE investigators say flydubai co-pilot was planning 'terrorist act'

 Rahul smacks century in India v Windies ODI

 Daryz seeks to join exclusive club of dual Arc winners

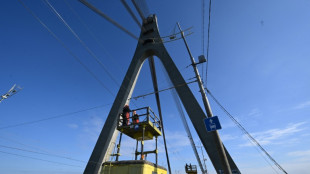 Russia warns diplomats to leave Kyiv over new strikes threat

 Olympic champ Zheng rebukes rowdy home crowd at China Open

 World No.1 Sinner pulls out of Shanghai Masters to delay return
 Red Bull's Verstappen grabs pole position for Bahrain GP

 India beat Pakistan in blockbuster as golfer Kim wins 'crazy' gold

 India beat arch-rivals Pakistan to win Asian Games cricket gold

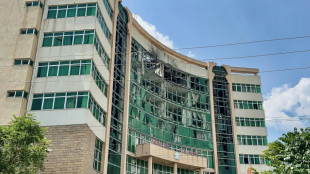
 Ethiopia's Tigray rebels abandon regional capital as govt advances: journalist

 Tom Kim powers to Games gold and exemption from military service

 Split loyalties for Indian football fans at Brazil friendly

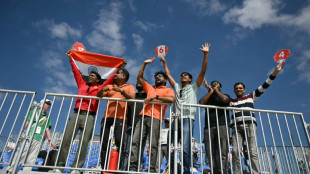 India-Pakistan blockbuster brings cricket fever to Japan baseball field

 Wong waiting on Rafa after winning Asian Games tennis gold

 With Russia next door and rising costs, Latvia goes to the polls

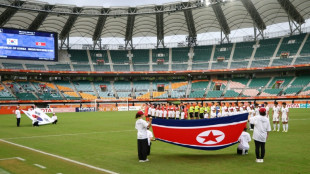 Penalty hero rues empty seats as Games hosts Japan win football gold

 North Korea fires ballistic missile after Seoul's apology demand

 US regulator finds Boeing 737 MAX software bug 'not a safety concern'

 Ohtani 'managing' injuries as Dodgers launch MLB post-season
 New "What Is a Gold IRA?" Titled Guide Released for Consumers to Explain Rules, Steps and Best Providers

 Botched US execution leaves murderer unconscious on ventilator: lawyers

 Cornell rape case exposes sexual violence at US colleges

 France held by Italy in Zidane's homecoming after Olise stunner

Subscription revenue increased 32%, and active subscriptions1 grew 41% to nearly 1.3 million
ARPMAU1 for the Zedge Marketplace increased 21% to $0.119; Zedge Premium GTV1 increased 17%
GAAP net income of $0.9 million; free cash flow2 increased 55% year over year
DataSeeds.AI fulfilled first six-figure order, demonstrating enterprise-scale execution capability
NEW YORK, NY / ACCESS Newswire / June 11, 2026 / Zedge, Inc. (NYSE American:ZDGE), $ZDGE, a company that builds and operates creator communities serving 20 million monthly active users, today announced results for its third quarter fiscal 2026, ended April 30, 2026.
Jonathan Reich, Zedge's CEO, commented:
"In our third quarter, we continued to demonstrate that the core Zedge Marketplace business is resilient and becoming more efficient. Subscription revenue grew 32% year over year, and active subscriptions reached nearly 1.3 million, both continuing a multi-quarter trend. ARPMAU increased 21%, and Zedge Premium GTV increased 17%, reflecting the benefits of our ongoing focus on acquiring and retaining higher-value users. While total advertising revenue declined year over year, that decline was entirely attributable to Emojipedia, which we are managing for overall return in light of Google's changes to its search results page. Within the Zedge Marketplace, advertising revenue was essentially flat year over year, a resilient result given that the prior year benefited from a one-time integration bonus from an ad platform partner. Encouragingly, iOS revenue within the Zedge Marketplace grew 35% year over year, reinforcing our message that, as we attract and monetize higher-value users in premium markets, the quality of our revenue continues to improve.
"On the DataSeeds.AI front, I am excited to report that we fulfilled our first six-figure order this quarter stemming from an existing customer relationship with a leading technology company. At the same time, we are beginning to see interest from new prospects, which strengthens our confidence in this offernig. This milestone reflects our growing capacity to deepen customer relationships and scale production. While revenue remains lumpy at this stage, successfully delivering projects of this size, on spec and within tight timeframes, is a necessary capability for DataSeeds' future growth.
"Our Innovation Team continues to advance - with four alpha products now live, and we remain on track to achieve our goal of six alpha launches this fiscal year. Our framework remains consistent: pre-validate, build fast, measure against clear KPIs and invest in the winners while quickly ceasing to spend on those that do not meet our criteria. Each launch compounds the next, as reusable infrastructure and lessons from prior releases shorten our time-to-market.
"Financially, cash flow from operations increased over 40%, while free cash flow increased 55% year over year to $1.2 million and is now up 10% year to date, and our cash and cash equivalents balance strengthened to $19.7 million with no debt. We also increased our quarterly dividend by 25% during the quarter, opportunistically repurchased shares when conditions warranted and invested in innovation, all without compromising our strong balance sheet. Subsequent to quarter's end, our board added $2 million to our existing share repurchase authorization, bringing total available capacity to approximately $2.2 million, reflecting our continued confidence in the value of our shares."
Third Quarter Highlights (fiscal 2026 versus fiscal 2025)
Revenue increased 3.0% to $8.0 million;
GAAP operating income of $1.1 million, compared to $0.2 million;
GAAP net income and diluted EPS of $0.9 million and $0.07, compared to $0.2 million and $0.01, respectively;
Non-GAAP net income and diluted Non-GAAP EPS of $1.0 million and $0.07, compared to $0.9 million and $0.06, respectively;
Free cash flow of $1.2 million, compared to $0.8 million;
Adjusted EBITDA2 of $1.3 million, compared to $1.2 million;
ARPMAU increased 21.2% to $0.119;
Zedge Premium GTV increased 16.6%;
Active subscriptions increased 40.6% to nearly 1.3 million;
Deferred revenue of $6.2 million, up 25.7% year over year;
Cash and cash equivalents were $19.7 million at quarter's end;
Paid a quarterly dividend of $0.02 per share.
Third Quarter Select Financial Metrics: FY26 versus FY25*
($ in MM except for per share amounts) | Q3 '26 | Q3 '25 | Change | YTD '26 | YTD '25 | Change | ||||||||
Total Revenue | $ | 8.0 | $ | 7.8 | 3.0 | % | $ | 23.9 | $ | 21.9 | 8.8 | % | ||
Advertising Revenue | $ | 5.4 | $ | 5.6 | -4.0 | % | $ | 16.1 | $ | 15.1 | 6.1 | % | ||
Digital Goods and Services Revenue | $ | 0.5 | $ | 0.5 | 6.9 | % | $ | 1.5 | $ | 1.7 | -12.3 | % | ||
Subscription Revenue | $ | 1.7 | $ | 1.3 | 31.9 | % | $ | 4.8 | $ | 3.7 | 31.1 | % | ||
Other Revenue | $ | 0.5 | $ | 0.4 | 4.6 | % | $ | 1.4 | $ | 1.4 | 4.9 | % | ||
GAAP Operating Income (Loss) | $ | 1.1 | $ | 0.2 | 571.3 | % | $ | (0.9 | ) | $ | (2.5 | ) | 64.1 | % |
Operating Margin | 13.4 | % | 2.1 | % | -3.8 | % | -11.5 | % | ||||||
GAAP Net Income (Loss) | $ | 0.9 | $ | 0.2 | 400.5 | % | $ | (0.6 | ) | $ | (1.8 | ) | 68.7 | % |
GAAP Diluted EPS | $ | 0.07 | $ | 0.01 | 600.0 | % | $ | (0.05 | ) | $ | (0.13 | ) | 61.5 | % |
Non-GAAP Net Income | $ | 1.0 | $ | 0.9 | 12.0 | % | $ | 2.6 | $ | 0.6 | 322.6 | % | ||
Non-GAAP Diluted EPS | $ | 0.07 | $ | 0.06 | 17.7 | % | $ | 0.20 | $ | 0.04 | 342.1 | % | ||
Cash Flow from Operations | $ | 1.2 | $ | 0.9 | 40.3 | % | $ | 2.9 | $ | 2.7 | 5.7 | % | ||
Free Cash Flow | $ | 1.2 | $ | 0.8 | 54.9 | % | $ | 2.6 | $ | 2.4 | 9.7 | % | ||
Adjusted EBITDA | $ | 1.3 | $ | 1.2 | 1.0 | % | $ | 3.6 | $ | 1.5 | 146.6 | % | ||
Shares Repurchased (M) | 0.08 | 0.22 | 0.33 | 0.68 | ||||||||||
nm = not measurable/meaningful
*percentages are based off of actuals versus the rounded numbers in the table
Select Zedge Marketplace Metrics: FY26 versus FY25*
(in MM except ARPMAU and where noted) | Q3 '26 | Q3 '25 | Change | |||
MAU | 19.6 | 22.1 | -11.3 | % | ||
Well-Developed Markets | 4.3 | 5.2 | -17.3 | % | ||
Emerging Markets | 15.3 | 16.9 | -9.5 | % | ||
Active Subscriptions (in 000s) | 1,260 | 896 | 40.6 | % | ||
ARPMAU | $ | 0.119 | $ | 0.099 | 21.2 | % |
Zedge Premium GTV | $ | 0.72 | $ | 0.61 | 16.6 | % |
*percentages are based off of actuals versus the rounded numbers in the table
Non-GAAP and Supplemental Metrics (Please see our 10-Q for full explanation of these terms)
1 We use the following supplemental business metrics in this release because we believe they are useful in evaluating Zedge's operational performance.
Monthly active users, or MAU, captures the number of unique users that used our Zedge App during the previous 30 days of the relevant period, is useful for evaluating consumer engagement with our App, which correlates to advertising revenue as more users drive more ad impressions.
Zedge Premium Gross Transaction Value, or GTV, is the total dollar amount of transactions conducted through Zedge Premium. As Zedge Premium is an internal focus for growth, we believe this metric will help investors evaluate our progress in growing this part of our business.
Average Revenue Per Monthly Active User for our Zedge Marketplace, or ARPMAU, is useful in evaluating how well we monetize our user base.
An Active Subscription is a subscription that has commenced and not been canceled, including paused subscriptions and subscriptions in free trials, grace periods, or account hold. This is important because it is a source of recurring revenue.
2 Throughout this release, Non-GAAP Net Income, Non-GAAP EPS, Free Cash Flow (FCF) and Adjusted EBITDA are non-GAAP financial measures intended to provide useful information that supplements Zedge's results in accordance with GAAP. Please refer to the Reconciliation of Non-GAAP Financial Measures at the end of this release for an explanation of Zedge's formulations of Non-GAAP Net Income, Non-GAAP EPS, Free Cash Flow and Adjusted EBITDA and reconciliations to the most directly comparable GAAP measures.
Trended Financial Information*
(in M except for EPS, ARPMAU, Paid Subscriptions)
Q125 | Q225 | Q325 | Q425 | Q126 | Q226 | Q326 | FY24 | FY25 | YTD FY26 | ||||||||||||||||||
Total Revenue | $ | 7.2 | $ | 7.0 | $ | 7.8 | $ | 7.5 | $ | 7.6 | $ | 8.3 | $ | 8.0 | $ | 30.1 | $ | 29.4 | $ | 23.9 | |||||||
Advertising Revenue | $ | 4.9 | $ | 4.7 | $ | 5.6 | $ | 5.2 | $ | 5.2 | $ | 5.6 | $ | 5.4 | $ | 21.0 | $ | 20.3 | $ | 16.1 | |||||||
Digital Goods and Services Revenue | $ | 0.6 | $ | 0.6 | $ | 0.5 | $ | 0.5 | $ | 0.5 | $ | 0.5 | $ | 0.5 | $ | 3.5 | $ | 2.2 | $ | 1.5 | |||||||
Subscription Revenue | $ | 1.2 | $ | 1.2 | $ | 1.3 | $ | 1.4 | $ | 1.5 | $ | 1.6 | $ | 1.7 | $ | 4.3 | $ | 5.1 | $ | 4.8 | |||||||
Other Revenue | $ | 0.5 | $ | 0.4 | $ | 0.4 | $ | 0.4 | $ | 0.5 | $ | 0.5 | $ | 0.5 | $ | 1.2 | $ | 1.8 | $ | 1.4 | |||||||
GAAP Operating Income (Loss) | $ | (0.5 | ) | $ | (2.2 | ) | $ | 0.2 | $ | (0.7 | ) | $ | 0.9 | $ | (2.9 | ) | $ | 1.1 | $ | (11.8 | ) | $ | (3.2 | ) | $ | (0.9 | ) |
GAAP Net Income (Loss) | $ | (0.3 | ) | $ | (1.7 | ) | $ | 0.2 | $ | (0.6 | ) | $ | 0.8 | $ | (2.3 | ) | $ | 0.9 | $ | (9.2 | ) | $ | (2.4 | ) | $ | (0.6 | ) |
GAAP Diluted EPS (Loss per share) | $ | (0.02 | ) | $ | (0.12 | ) | $ | 0.01 | $ | (0.04 | ) | $ | 0.06 | $ | (0.18 | ) | $ | 0.07 | $ | (0.65 | ) | $ | (0.17 | ) | $ | (0.05 | ) |
Non GAAP Net Income (Loss) | $ | (0.0 | ) | $ | (0.2 | ) | $ | 0.9 | $ | 0.1 | $ | 0.9 | $ | 0.8 | $ | 1.0 | $ | 1.8 | $ | 0.7 | $ | 2.6 | |||||
Non-GAAP Diluted EPS (Loss per share) | $ | (0.00 | ) | $ | (0.01 | ) | $ | 0.06 | $ | 0.00 | $ | 0.07 | $ | 0.06 | $ | 0.07 | $ | 0.13 | $ | 0.05 | $ | 0.20 | |||||
Cash Flow from Operations | $ | 1.2 | $ | 0.7 | $ | 0.9 | $ | 0.7 | $ | 0.8 | $ | 0.9 | $ | 1.2 | $ | 5.9 | $ | 3.4 | $ | 2.9 | |||||||
Free Cash Flow | $ | 1.0 | $ | 0.6 | $ | 0.8 | $ | 0.5 | $ | 0.6 | $ | 0.8 | $ | 1.2 | $ | 4.7 | $ | 2.9 | $ | 2.6 | |||||||
Adjusted EBITDA | $ | 0.3 | $ | (0.1 | ) | $ | 1.2 | $ | 0.3 | $ | 1.2 | $ | 1.1 | $ | 1.3 | $ | 4.7 | $ | 1.8 | $ | 3.6 | ||||||
Adjusted EBITDA Margin | 4.0 | % | -1.1 | % | 16.1 | % | 4.1 | % | 15.6 | % | 13.9 | % | 15.8 | % | 15.6 | % | 6.0 | % | 15.1 | % | |||||||
MAU | 25.0 | 24.7 | 22.1 | 23.2 | 22.2 | 20.4 | 19.6 | nm | nm | nm | |||||||||||||||||
Well-developed Markets | 5.5 | 5.6 | 5.2 | 5.4 | 4.9 | 4.8 | 4.3 | nm | nm | nm | |||||||||||||||||
Emerging Markets | 19.5 | 19.1 | 16.9 | 17.8 | 17.3 | 15.6 | 15.3 | nm | nm | nm | |||||||||||||||||
Active Subscriptions (in 000s) | 698 | 791 | 896 | 984 | 1,075 | 1,175 | 1,260 | nm | nm | nm | |||||||||||||||||
ARPMAU | $ | 0.077 | $ | 0.078 | $ | 0.099 | $ | 0.093 | $ | 0.099 | $ | 0.115 | $ | 0.119 | nm | nm | nm | ||||||||||
Zedge Premium - GTV | $ | 0.68 | $ | 0.68 | $ | 0.61 | $ | 0.64 | $ | 0.66 | $ | 0.79 | $ | 0.72 | $ | 2.15 | $ | 2.62 | $ | 2.16 | |||||||
Shares Repurchased | 0.22 | 0.24 | 0.22 | 0.64 | 0.24 | 0.01 | 0.08 | 0.21 | 1.32 | 0.33 | |||||||||||||||||
nm = not measurable/meaningful
*numbers may not add due to rounding
Earnings Announcement and Supplemental Information
Management will host an earnings conference call today at 4:30 pm Eastern to discuss its earnings results, outlook, and strategy, followed by a Q&A session with investors.
Live Call-in Info:
Toll Free: 888-506-0062
International: 973-528-0011
Participant Access Code: 184704
Webcast URL: https://www.webcaster5.com/Webcast/Page/2205/53991
Replay:
Toll Free: 877-481-4010
International: 919-882-2331
Replay Passcode: 53991
About Zedge
Zedge builds and operates creator communities that serve 20 million monthly active users across its platforms. Zedge Marketplace, our flagship platform, is a leading marketplace for mobile personalization content that powers a vibrant creator ecosystem including a full generative AI creation suite. DataSeeds.AI is our B2B business, delivering managed, multimodal datasets that are ethically sourced, rights-cleared, built to spec and delivered at scale to frontier AI developers. The content foundation for DataSeeds.AI is supplied by Zedge's proprietary creator communities, including Zedge Marketplace contributors and photo competition community GuruShots, the world's most popular photo competition game, which is supplemented by crowdsourced content. For more information please visit: investor.zedge.net
Follow us on X: @Zedge
Follow us on LinkedIn
Forward-Looking Statements
All statements above that are not purely about historical facts, including, but not limited to, those in which we use the words "believe," "anticipate," "expect," "plan," "intend," "estimate," "target" and similar expressions, are forward-looking statements within the meaning of the Private Securities Litigation Reform Act of 1995. While these forward-looking statements represent our current judgment of what may happen in the future, actual results may differ materially from the results expressed or implied by these statements due to numerous important factors. Our filings with the SEC provide detailed information on such statements and risks and should be consulted along with this release. To the extent permitted under applicable law, we assume no obligation to update any forward-looking statements.
Contact:
Brian Siegel, IRC, MBA
Senior Managing Director
Hayden IR
(346) 396-8696
[email protected]
[email protected]
CONDENSED CONSOLIDATED BALANCE SHEETS
(in thousands, except par value data)
April 30, | July 31, | |||
2026 | 2025 | |||
(Unaudited) | ||||
Assets | ||||
Current assets: | ||||
Cash and cash equivalents | $ | 19,692 | $ | 18,609 |
Trade accounts receivable | 3,908 | 3,164 | ||
Prepaid expenses and other current assets | 799 | 671 | ||
Total Current assets | 24,399 | 22,444 | ||
Property and equipment, net | 1,224 | 1,290 | ||
Intangible assets, net | 1,065 | 4,922 | ||
Goodwill | 2,138 | 1,931 | ||
Deferred tax assets, net | 5,041 | 4,823 | ||
Other assets | 437 | 244 | ||
Total assets | $ | 34,304 | $ | 35,654 |
Liabilities and stockholders' equity | ||||
Current liabilities: | ||||
Trade accounts payable | $ | 1,258 | $ | 1,471 |
Accrued expenses and other current liabilities | 2,178 | 2,867 | ||
Deferred revenues | 4,159 | 3,425 | ||
Total Current liabilities | 7,595 | 7,763 | ||
Deferred revenues--non-current | 1,998 | 1,937 | ||
Other liabilities | 153 | 53 | ||
Total liabilities | 9,746 | 9,753 | ||
Commitments and contingencies (Note 9) | ||||
Stockholders' equity: | ||||
Preferred stock, $.01 par value; authorized shares-2,400; no shares issued and outstanding | - | - | ||
Class A common stock, $.01 par value; authorized shares-2,600; 525 shares issued and outstanding at April 30, 2026 and July 31, 2025 | 5 | 5 | ||
Class B common stock, $.01 par value; authorized shares-40,000; 15,238 shares issued and 12,523 outstanding at April 30, 2026 and 15,073 shares issued and 12,692 shares outstanding at July 31, 2025 | 152 | 151 | ||
Additional paid-in capital | 49,676 | 49,768 | ||
Accumulated other comprehensive loss | (1,057 | ) | (1,509 | ) |
Accumulated deficit | (16,080 | ) | (15,505 | ) |
Treasury stock, 2,715 shares at April 30, 2026 and 2,381 shares at July 31, 2025, at cost | (8,138 | ) | (7,009 | ) |
Total stockholders' equity | 24,558 | 25,901 | ||
Total liabilities and stockholders' equity | $ | 34,304 | $ | 35,654 |
ZEDGE, INC.
CONDENSED CONSOLIDATED STATEMENTS OF OPERATIONS AND COMPREHENSIVE LOSS
(in thousands, except per share data)
(unaudited)
Three Months Ended | Nine Months Ended | ||||||||||
April 30, | April 30, | ||||||||||
2026 | 2025 | 2026 | 2025 | ||||||||
Revenues | $ | 7,992 | $ | 7,757 | $ | 23,856 | $ | 21,930 | |||
Costs and expenses: | |||||||||||
Direct cost of revenues (excluding amortization of capitalized software and technology development costs which is included below) | 550 | 452 | 1,651 | 1,360 | |||||||
Selling, general and administrative | 6,235 | 6,343 | 18,848 | 20,278 | |||||||
Depreciation and amortization | 133 | 225 | 536 | 924 | |||||||
Impairment of intangible assets | - | - | 3,570 | - | |||||||
Restructuring charges | - | 577 | - | 1,058 | |||||||
Impairment of capitalized software and technology development costs | - | - | 145 | 827 | |||||||
Income (loss) from operations | 1,074 | 160 | (894 | ) | (2,517 | ) | |||||
Interest and other income, net | 135 | 154 | 403 | 507 | |||||||
Net loss resulting from foreign exchange transactions | (26 | ) | (41 | ) | (211 | ) | (141 | ) | |||
Income (loss) before income taxes | 1,183 | 273 | (702 | ) | (2,151 | ) | |||||
Income tax expense (benefit) | 257 | 88 | (127 | ) | (318 | ) | |||||
Net income (loss) | $ | 926 | $ | 185 | $ | (575 | ) | $ | (1,833 | ) | |
Other comprehensive income: | |||||||||||
Changes in foreign currency translation adjustment | 117 | 448 | 452 | 287 | |||||||
Total other comprehensive income | 117 | 448 | 452 | 287 | |||||||
Total comprehensive income (loss) | $ | 1,043 | $ | 633 | $ | (123 | ) | $ | (1,546 | ) | |
Income (loss) per share attributable to Zedge, Inc. common stockholders: | |||||||||||
Basic | $ | 0.07 | $ | 0.01 | $ | (0.04 | ) | $ | (0.13 | ) | |
Diluted | $ | 0.07 | $ | 0.01 | $ | (0.04 | ) | $ | (0.13 | ) | |
Weighted-average number of shares used in calculation of income (loss) per share: | |||||||||||
Basic | 13,002 | 13,720 | 12,992 | 13,835 | |||||||
Diluted | 13,272 | 13,940 | 12,992 | 13,835 | |||||||
ZEDGE, INC.
CONDENSED CONSOLIDATED STATEMENTS OF CASH FLOWS
(in thousands)
(unaudited)
Nine Months Ended | ||||||
April 30, | ||||||
2026 | 2025 | |||||
Operating activities | ||||||
Net loss | $ | (575 | ) | $ | (1,833 | ) |
Adjustments to reconcile net loss to net cash provided by operating activities: | ||||||
Depreciation | 43 | 48 | ||||
Amortization of intangible assets | 286 | 335 | ||||
Amortization of capitalized software and technology development costs | 207 | 541 | ||||
Stock-based compensation | 457 | 1,308 | ||||
Impairment charge of capitalized software and technology development costs | 145 | 827 | ||||
Impairment charge of intangible assets | 3,570 | - | ||||
Deferred income taxes | (218 | ) | (184 | ) | ||
Change in assets and liabilities: | ||||||
Trade accounts receivable | (744 | ) | 87 | |||
Prepaid expenses and other current assets | (128 | ) | (353 | ) | ||
Other assets | (42 | ) | (54 | ) | ||
Trade accounts payable and accrued expenses | (892 | ) | 229 | |||
Deferred revenues | 795 | 1,797 | ||||
Net cash provided by operating activities | 2,904 | 2,748 | ||||
Investing activities | ||||||
Capitalized software and technology development costs | (278 | ) | (329 | ) | ||
Purchase of property and equipment | (26 | ) | (49 | ) | ||
Net cash used in investing activities | (304 | ) | (378 | ) | ||
Financing activities | ||||||
Purchase of treasury stock in connection with share buyback program and stock awards vesting | (1,129 | ) | (2,030 | ) | ||
Payment of cash dividends | (677 | ) | - | |||
Proceeds from exercise of stock options | 129 | - | ||||
Net cash used in financing activities | (1,677 | ) | (2,030 | ) | ||
Effect of exchange rate changes on cash and cash equivalents | 160 | 95 | ||||
Net increase in cash and cash equivalents | 1,083 | 435 | ||||
Cash and cash equivalents at beginning of period | 18,609 | 19,998 | ||||
Cash and cash equivalents at end of period | $ | 19,692 | $ | 20,433 | ||
Supplemental cash flow information: | ||||||
Cash paid for income taxes | $ | 176 | $ | 194 | ||
Non-cash operating and financing activities: | ||||||
ROU assets obtained in exchange for lease liabilities | $ | 286 | $ | 111 | ||
Use of Non-GAAP Measures and Key Performance Indcators (KPI)
Adjusted EBITDA, defined as earnings (loss) before interest, taxes, depreciation and amortization, stock compensation expense, transaction-related expenses and other non-recurring expenses, Free Cash Flow, a common metric used by investors for valuation, and non-GAAP net income (loss) and EPS (or loss per share) (which adjust out stock compensation expense, transaction-related expenses and other non-recurring expenses from GAAP net income (loss) and EPS (loss pershare)), represent measures that we believe are customarily used by investors and analysts to evaluate the financial performance of companies in addition to the GAAP measures we present. Our management also believes these measures are useful in evaluating our core operating results. However, these are not measures of financial performance under GAAP and should not be considered an alternative to net income or operating income/margin as an indicator of our operating performance or to net cash provided by operating activities as a measure of our liquidity. Numbers in the following reconciliation tables may not add due to rounding.
Reconciliation of Adjusted EBITDA to Net Income (Loss) | Q125 | Q225 | Q325 | Q425 | Q126 | Q226 | Q326 | FY24 | FY25 | YTD FY26 | ||||||||||||||||||||
Net Income (Loss) | $ | (0.3 | ) | $ | (1.7 | ) | $ | 0.2 | $ | (0.6 | ) | $ | 0.8 | $ | (2.3 | ) | $ | 0.9 | $ | (9.2 | ) | $ | (2.4 | ) | $ | (0.6 | ) | |||
Excluding: | ||||||||||||||||||||||||||||||
Interest and other income (expense), net | $ | (0.2 | ) | $ | (0.2 | ) | $ | (0.2 | ) | $ | (0.2 | ) | $ | (0.2 | ) | $ | (0.1 | ) | $ | (0.1 | ) | $ | (0.6 | ) | $ | (0.7 | ) | $ | (0.4 | ) |
Income tax expense (benefit) | $ | 0.0 | $ | (0.5 | ) | $ | 0.1 | $ | (0.0 | ) | $ | 0.2 | $ | (0.6 | ) | $ | 0.3 | $ | (2.2 | ) | $ | (0.3 | ) | $ | (0.1 | ) | ||||
Depreciation and amortization | $ | 0.4 | $ | 0.3 | $ | 0.2 | $ | 0.2 | $ | 0.2 | $ | 0.2 | $ | 0.1 | $ | 2.5 | $ | 1.1 | $ | 0.5 | ||||||||||
EBITDA | $ | (0.1 | ) | $ | (2.0 | ) | $ | 0.3 | $ | (0.5 | ) | $ | 1.1 | $ | (2.8 | ) | $ | 1.2 | $ | (9.5 | ) | $ | (2.2 | ) | $ | (0.6 | ) | |||
Adjustments: | ||||||||||||||||||||||||||||||
Asset impairments and restructuring charges | $ | 0.0 | $ | 1.3 | $ | 0.6 | $ | 0.6 | $ | 0.0 | $ | 3.7 | $ | 0.0 | $ | 12.0 | $ | 2.5 | $ | 3.7 | ||||||||||
Stock-based compensation | $ | 0.4 | $ | 0.6 | $ | 0.3 | $ | 0.1 | $ | 0.1 | $ | 0.3 | $ | 0.1 | $ | 2.1 | $ | 1.4 | $ | 0.5 | ||||||||||
Expenses related to restructuring activities and business combination | $ | 0.0 | $ | 0.0 | $ | 0.0 | $ | 0.1 | $ | 0.0 | $ | 0.0 | $ | 0.0 | $ | 0.2 | $ | 0.1 | $ | 0.0 | ||||||||||
Adjusted EBITDA | $ | 0.3 | $ | (0.1 | ) | $ | 1.2 | $ | 0.3 | $ | 1.2 | $ | 1.1 | $ | 1.3 | $ | 4.7 | $ | 1.8 | $ | 3.6 | |||||||||
*numbers may not add due to rounding
Reconciliation of GAAP Net Income (Loss) to Non-GAAP Net Income | Q125 | Q225 | Q325 | Q425 | Q126 | Q226 | Q326 | FY24 | FY25 | YTD FY26 | ||||||||||||||||||||
GAAP Net Income (Loss) | $ | (0.3 | ) | $ | (1.7 | ) | $ | 0.2 | $ | (0.6 | ) | $ | 0.8 | $ | (2.3 | ) | $ | 0.9 | $ | (9.2 | ) | $ | (2.4 | ) | $ | (0.6 | ) | |||
Adjustments: | ||||||||||||||||||||||||||||||
Asset impairments and restructuring charges | $ | 0.0 | $ | 1.3 | $ | 0.6 | $ | 0.6 | $ | 0.0 | $ | 3.7 | $ | 0.0 | $ | 12.0 | $ | 2.5 | $ | 3.7 | ||||||||||
Stock-based compensation | $ | 0.4 | $ | 0.6 | $ | 0.3 | $ | 0.1 | $ | 0.1 | $ | 0.3 | $ | 0.1 | $ | 2.1 | $ | 1.4 | $ | 0.5 | ||||||||||
Expenses related to restructuring activities and business combination | $ | 0.0 | $ | 0.0 | $ | 0.0 | $ | 0.1 | $ | 0.0 | $ | 0.0 | $ | 0.0 | $ | 0.2 | $ | 0.1 | $ | 0.0 | ||||||||||
Income tax effect on non-GAAP items | $ | (0.1 | ) | $ | (0.4 | ) | $ | (0.2 | ) | $ | (0.2 | ) | $ | (0.0 | ) | $ | (0.9 | ) | $ | (0.0 | ) | $ | (3.3 | ) | $ | (0.9 | ) | $ | (1.0 | ) |
Non-GAAP Net Income (Loss) | $ | (0.0 | ) | $ | (0.2 | ) | $ | 0.9 | $ | 0.1 | $ | 0.9 | $ | 0.8 | $ | 1.0 | $ | 1.8 | $ | 0.7 | $ | 2.6 | ||||||||
Non-GAAP basic EPS (loss per share) | $ | (0.00 | ) | $ | (0.01 | ) | $ | 0.06 | $ | 0.00 | $ | 0.07 | $ | 0.06 | $ | 0.08 | $ | 0.13 | $ | 0.05 | $ | 0.20 | ||||||||
Non-GAAP diluted EPS (loss per share) | $ | (0.00 | ) | $ | (0.01 | ) | $ | 0.06 | $ | 0.00 | $ | 0.07 | $ | 0.06 | $ | 0.07 | $ | 0.13 | $ | 0.05 | $ | 0.20 | ||||||||
Weighted average shares used to compute Non-GAAP basic earnings per share | 14.1 | 13.9 | 13.7 | 13.4 | 13.0 | 13.0 | 13.0 | 14.1 | 13.7 | 13.0 | ||||||||||||||||||||
Weighted average shares used to compute Non-GAAP diluted earnings per share | 14.1 | 13.9 | 13.9 | 13.4 | 13.3 | 13.0 | 13.3 | 14.1 | 13.7 | 13.3 | ||||||||||||||||||||
*numbers may not add due to rounding
Free Cash Flow Calculation | Q125 | Q225 | Q325 | Q425 | Q126 | Q226 | Q326 | FY24 | FY25 | YTD FY26 | ||||||||||
Cash Flow from Operations | $ | 1.2 | $ | 0.7 | $ | 0.9 | $ | 0.7 | $ | 0.8 | $ | 0.9 | $ | 1.2 | $ | 5.9 | $ | 3.4 | $ | 2.9 |
Capital Expenditures | $ | 0.2 | $ | 0.1 | $ | 0.1 | $ | 0.2 | $ | 0.2 | $ | 0.1 | $ | 0.0 | $ | 1.2 | $ | 0.5 | $ | 0.3 |
Free Cash Flow | $ | 1.0 | $ | 0.6 | $ | 0.8 | $ | 0.5 | $ | 0.6 | $ | 0.8 | $ | 1.2 | $ | 4.7 | $ | 2.9 | $ | 2.6 |
SOURCE: Zedge, Inc.
View the original press release on ACCESS Newswire
D.Lopez--AT