
Pampa Energía Announces Fiscal Year and Fourth Quarter 2025 Results

 European stocks retreat as France violence spreads

 North Korea warns 'grave situation' prevailing along border

 Raya proud of Arsenal's 'incredible' reaction after third straight win

 Indonesia fires have burned nearly two million hectares: monitor

 Australian lawmaker 'critically' hurt in attack, officials say

 Indonesia fires burned over 1.9 mn hectares through September: monitor

 Asian tech stocks mixed after Wall St losses, eyes on earnings
 China's third-quarter growth narrowly beats forecasts

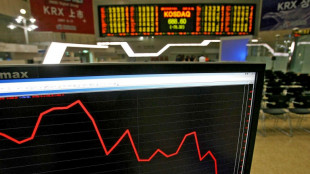 Asian stocks start week on back foot, tracking tech-led Wall St losses

 China growth narrowly beats forecasts

 Faith and fury: Texas Senate rivals offer contrasting visions
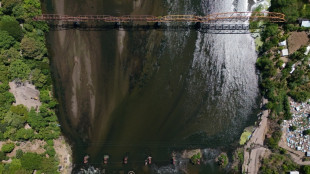
 Women await justice for police killings in Brazil

 The painstaking task of cataloguing the world's species

 Nations seek reset at UN talks as nature goals off track

 Rubio seeks to strengthen US foothold in Central Asia

 LeBron joins 76ers to chase one more NBA title at age 41

 Rays one win from World Series return after downing Guardians

 Stillwater Critical Minerals Files NI 43-101 Technical Report for the Updated Stillwater West Mineral Resource Estimate in Montana, USA

 Caledonia Mining Corporation Plc: Notification of Relevant Change To Significant Shareholder

 BioNxt Completes GMP Manufacturing and Submits Clinical Trial Application for Sublingual Cladribine Drug Candidate

 DEA Denies Federal Marijuana Manufacturing License: Are State Operators Next?

 Great Western Mining Corporation PLC Announces Holding(s) in Company

 HyProMag USA Deploys Mobile Inserma System, Extending Hard Disk Drive Processing to Customer Sites Across the United States

 CoTec Holdings Corp. Notes HyProMag USA Deployment of Mobile Inserma System, Extending Hard Disk Drive Processing to Customer Sites Across the United States
 Kings' Ben Simmons tears Achilles in training

BUENOS AIRES, AR / ACCESS Newswire / March 2, 2026 / Pampa Energía S.A. (NYSE:PAM)(Buenos Aires Stock Exchange:PAMP), an independent company with active participation in Argentine oil, gas and electricity, announces the results for the fiscal year and quarter ended on December 31, 2025.
Pampa reports its financial information in US$, its functional currency. For local currency equivalents, transactional exchange rate ('FX') is applied. However, Transener and Transportadora de Gas del Sur's ('TGS') figures are adjusted for inflation as of December 31, 2025, and converted into US$ using the period-end FX. Previously reported figures remained unchanged.
Fourth quarter 2025 ('Q4 25') main results1
Sales recorded US$507 million in Q4 252, a 16% year-on-year increase, driven by higher crude oil production at Rincón de Aranda, improved spot prices under the new Wholesale Electricity Market ('WEM') framework for our thermal units and higher gas exports to Chile, offset by lower income from the styrenics business and from units under Power Purchase Agreements ('PPAs').
Q4 25 was market by sustained shale oil growth at Rincón de Aranda and strong performance across our thermal power plants.
Pampa's main operational KPIs | Q4 25 | Q4 24 | Variation | |||
Oil and gas | ||||||
Production (kboe/day) | 81.2 | 61.6 | +32 | % | ||
Gas production (kboepd) | 63.2 | 57.6 | +10 | % | ||
Crude oil production (kbpd) | 18.0 | 4.0 | +355 | % | ||
Average gas price (US$/MBTU) | 3.0 | 2.9 | +4 | % | ||
Average oil price (US$/bbl)* | 60.9 | 67.6 | -10 | % | ||
Power | ||||||
Generation (GWh) | 4,947 | 4,797 | +3 | % | ||
Gross margin (US$/MWh) | 26.6 | 22.8 | +16 | % | ||
Petrochemicals | ||||||
Volume sold (k ton) | 129 | 121 | +7 | % | ||
Average price (US$/ton) | 886 | 1,017 | -13 | % | ||
Note: * Price net of export duty and quality/logistic discounts.
Adjusted EBITDA3 reached US$230 million in Q4 25, a 26% year-on-year increase, mainly reflecting the growing contribution from Rincón de Aranda, the impact of the WEM's new framework in power generation, higher gas exports and stronger reforming margins. These effects were partially offset by lower contributions from PPAs and by the deconsolidation of Oleoducto de Crudos Pesados S.A. ('OCP Ecuador') within the holding, transport, and others.
Net income attributable to shareholders was US$161 million, 52% higher than Q4 24, driven by stronger operating margins and the recognition of a non-cash deferred income tax credit, as inflation outpaced the AR$ devaluation during Q4 25, offset by weaker net financial results.
1The information is based on financial statements ('FS') prepared according to International Financial Reporting Standards ('IFRS') in force in Argentina.
2Sales from the affiliates CTBSA, Transener and TGS are excluded, shown as 'Results for participation in joint businesses and associates.'
3Consolidated adjusted EBITDA represents the flows before financial items, income tax, depreciations and amortizations, extraordinary and non-cash income and expense, equity income, and includes affiliates' EBITDA at our ownership. Further information on section 3.1.
Net debt decreased to US$801 million as of December 2025, compared to US$874 million as of September 2025, reflecting solid free cash flow generation and reduced collateral requirements.
Consolidated balance sheet
(As of December 31, 2025 and December 2024, in millions)
In US$ million | As of 12.31.2025 | As of 12.31.2024 | ||
ASSETS | ||||
Property, plant and equipment | 3,303 | 2,607 | ||
Intangible assets | 89 | 95 | ||
Right-of-use assets | 36 | 11 | ||
Deferred tax asset | 43 | 157 | ||
Investments in associates and joint ventures | 1,059 | 993 | ||
Financial assets at fair value through profit and loss | 33 | 27 | ||
Trade and other receivables | 43 | 75 | ||
Total non-current assets | 4,606 | 3,965 | ||
Inventories | 231 | 223 | ||
Financial assets at amortized cost | - | 80 | ||
Financial assets at fair value through profit and loss | 366 | 850 | ||
Derivative financial instruments | 52 | 1 | ||
Trade and other receivables | 614 | 488 | ||
Cash and cash equivalents | 725 | 738 | ||
Total current assets | 1,988 | 2,380 | ||
Total assets | 6,594 | 6,345 | ||
EQUITY | ||||
Share capital | 36 | 36 | ||
Share capital adjustment | 191 | 191 | ||
Share premium | 516 | 516 | ||
Treasury shares adjustment | 1 | 1 | ||
Treasury shares cost | (54 | ) | (7 | ) |
Legal reserve | 44 | 44 | ||
Voluntary reserve | 2,399 | 1,657 | ||
Other reserves | (12 | ) | (13 | ) |
Other comprehensive income | 124 | 119 | ||
Retained earnings | 351 | 742 | ||
Equity attributable to owners of the company | 3,596 | 3,286 | ||
Non-controlling interest | 9 | 9 | ||
Total equity | 3,605 | 3,295 | ||
LIABILITIES | ||||
Provisions | 100 | 137 | ||
Income tax and minimum notional income tax provision | 26 | 75 | ||
Tax liabilities | 212 | - | ||
Deferred tax liability | 56 | 49 | ||
Defined benefit plans | 26 | 30 | ||
Borrowings | 1,844 | 1,373 | ||
Trade and other payables | 86 | 84 | ||
Total non-current liabilities | 2,350 | 1,748 | ||
Provisions | 13 | 10 | ||
Income tax liability | 83 | 257 | ||
Tax liabilities | 56 | 30 | ||
Defined benefit plans | 6 | 7 | ||
Salaries and social security payable | 36 | 39 | ||
Borrowings | 48 | 706 | ||
Trade and other payables | 397 | 253 | ||
Total current liabilities | 639 | 1,302 | ||
Total liabilities | 2,989 | 3,050 | ||
Total liabilities and equity | 6,594 | 6,345 | ||
Consolidated income statement
(For the fiscal year and quarters ended on December 31, 2025 and 2024, in millions)
In US$ million | Fiscal year | Fourth quarter | ||||||||||
2025 | 2024 | 2025 | 2024 | |||||||||
Sales revenue | 1,998 | 1,876 | 507 | 435 | ||||||||
Domestic sales | 1,618 | 1,575 | 411 | 368 | ||||||||
Foreign market sales | 380 | 301 | 96 | 67 | ||||||||
Cost of sales | (1,369 | ) | (1,279 | ) | (369 | ) | (349 | ) | ||||
Gross profit | 629 | 597 | 138 | 86 | ||||||||
Selling expenses | (98 | ) | (74 | ) | (29 | ) | (17 | ) | ||||
Administrative expenses | (192 | ) | (239 | ) | (61 | ) | (100 | ) | ||||
Exploration expenses | - | (21 | ) | - | (21 | ) | ||||||
Other operating income | 100 | 175 | 15 | 59 | ||||||||
Other operating expenses | (72 | ) | (88 | ) | (10 | ) | (16 | ) | ||||
Impairment of financial assets | (21 | ) | (56 | ) | (16 | ) | - | |||||
Recovery of impairment (Impairment) of PPE, int. assets and inventories | 15 | (34 | ) | 23 | (15 | ) | ||||||
Results for part. in joint businesses & associates | 142 | 146 | 41 | 45 | ||||||||
Income from the sale of associates | - | 34 | - | 27 | ||||||||
Operating income | 503 | 440 | 101 | 48 | ||||||||
Financial income | 45 | 32 | 3 | 28 | ||||||||
Financial costs | (196 | ) | (185 | ) | (45 | ) | (48 | ) | ||||
Other financial results | 230 | 211 | 93 | 97 | ||||||||
Financial results, net | 79 | 58 | 51 | 77 | ||||||||
Profit before tax | 582 | 498 | 152 | 125 | ||||||||
Income tax | (204 | ) | 121 | 10 | (19 | ) | ||||||
Net income for the period | 378 | 619 | 162 | 106 | ||||||||
Attributable to the owners of the Company | 377 | 619 | 161 | 106 | ||||||||
Attributable to the non-controlling interest | 1 | - | 1 | - | ||||||||
Net income per share to shareholders | 0.3 | 0.5 | 0.1 | 0.1 | ||||||||
Net income per ADR to shareholders | 6.9 | 11.4 | 3.0 | 1.9 | ||||||||
Average outstanding common shares1 | 1,360 | 1,360 | 1,360 | 1,360 | ||||||||
Outstanding shares by the end of period1 | 1,360 | 1,360 | 1,360 | 1,360 | ||||||||
Consolidated cash flow statement
(For the fiscal year and quarters ended on December 31, 2025 and 2024, in millions)
In US$ million | Fiscal year | Fourth quarter | ||||||||||
2025 | 2024 | 2025 | 2024 | |||||||||
OPERATING ACTIVITIES | ||||||||||||
Profit of the period | 378 | 619 | 162 | 106 | ||||||||
Adjustments to reconcile net profit to cash flows from operating activities | 418 | 152 | 11 | 12 | ||||||||
Changes in operating assets and liabilities | (18 | ) | (336 | ) | 115 | 31 | ||||||
(Increase) decrease in trade receivables and other receivables | (100) | (411) | 119 | 47 | ||||||||
(Increase) decrease in inventories | (13) | (20) | 21 | 13 | ||||||||
Increase in trade and other payables | 69 | 75 | (25) | (5) | ||||||||
Increase in salaries and social security payables | 10 | 25 | 8 | 10 | ||||||||
Defined benefit plans payments | (3) | (3) | (1) | (1) | ||||||||
Increase (decrease) in tax liabilities | 22 | 17 | (3) | (17) | ||||||||
Decrease in provisions | (10) | (19) | (3) | (16) | ||||||||
Income tax payment | (8) | - | (8) | - | ||||||||
Collection for derivative financial instruments, net | 15 | - | 7 | - | ||||||||
Net cash generated by (used in) operating activities | 778 | 435 | 288 | 149 | ||||||||
INVESTING ACTIVITIES | ||||||||||||
Payment for property, plant and equipment acquisitions | (993 | ) | (447 | ) | (242 | ) | (97 | ) | ||||
Collection for sales (Payment for purchases) of public securities and shares, net | 592 | (5 | ) | 216 | 21 | |||||||
Recovery (Suscription) of mutual funds, net | 3 | (10 | ) | (8 | ) | (9 | ) | |||||
Capital integration in companies | (44 | ) | - | (3 | ) | - | ||||||
Payment for companies' acquisitions | (1 | ) | (48 | ) | (1 | ) | - | |||||
Collection for equity interests in companies sales | 1 | 39 | - | 21 | ||||||||
Collection for joint ventures' share repurchase | - | 37 | - | - | ||||||||
Collections for intangible assets sales | 9 | - | - | - | ||||||||
Dividends collection | 25 | 9 | - | 1 | ||||||||
Collection for equity interests in areas sales | 7 | 9 | 5 | 9 | ||||||||
Cash addition from purchase of subsidiary | - | 71 | - | - | ||||||||
Collection of loans, net | - | 1 | - | 1 | ||||||||
Net cash generated by (used in) investing activities | (401 | ) | (344 | ) | (33 | ) | (53 | ) | ||||
FINANCING ACTIVITIES | ||||||||||||
Proceeds from borrowings | 986 | 1,174 | 432 | 464 | ||||||||
Payment of borrowings | (306 | ) | (236 | ) | (178 | ) | (142 | ) | ||||
Payment of borrowings interests | (161 | ) | (145 | ) | (39 | ) | (27 | ) | ||||
Repurchase and redemption of corporate bonds | (837 | ) | (313 | ) | (111 | ) | 16 | |||||
Payment for treasury shares acquisition | (47 | ) | - | (31 | ) | - | ||||||
Payment of dividends | (1 | ) | - | (1 | ) | - | ||||||
Payment of leases | (24 | ) | (4 | ) | (13 | ) | (1 | ) | ||||
Net cash (used in) generated by financing activities | (390 | ) | 476 | 59 | 310 | |||||||
(Decrease) Increase in cash and cash equivalents | (13 | ) | 567 | 314 | 406 | |||||||
Cash and cash equivalents at the beginning of the period | 738 | 171 | 411 | 332 | ||||||||
(Decrease) Increase in cash and cash equivalents | (13 | ) | 567 | 314 | 406 | |||||||
Cash and cash equivalents at the end of the period | 725 | 738 | 725 | 738 | ||||||||
For the full version of the Earnings Report, please visit Pampa's Investor Relations website: ri.pampa.com/en.
Information about the videoconference
There will be a videoconference to discuss Pampa's Q4 25 results on Monday, March 2, 2026, at 4:30 p.m. Eastern Standard Time/6:30 p.m. Buenos Aires Time. The hosts will be Gustavo Mariani, CEO, head of oil and gas Horacio Turri, Adolfo Zuberbühler, CFO and Lida Wang, IR & ESG Officer at Pampa.
For those interested in participating, please register here.
For further information about Pampa:
SOURCE: 1/3 Pampa Energía S.A.
View the original press release on ACCESS Newswire
T.Wright--AT