
Jerash Holdings Reports Financial Results for Fiscal 2025 Fourth Quarter and Full Year

 Godzilla Minus Zero Review: Takashi Yamazaki’s Anti-Nuclear Allegory

 DA Demands No-Work-No-Pay for Striking Municipal Workers in Coalition Talks

 US Wholesale Inflation Eases Monthly but Hits a Four-Year Annual High

 India's Wholesale Inflation Jumps to 12.29% as Fuel Costs Surge

 China's October Activity Data Reveal a Weak Start to the Fourth Quarter

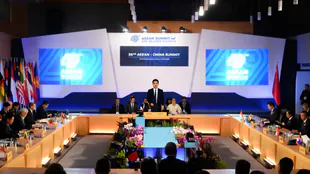 Philippines Urges ASEAN and China to Accelerate South China Sea Code of Conduct

 Mbeki Claims No Progress Since 2018; Author Cites Infrastructure and Economic Gains

 Qatar's Amir and Venezuelan Acting President Discuss Energy Cooperation

 GameSquare Holdings Reports 2026 Third Quarter Results with Revenue up 77% YoY and Net Income Reaches $10.1 Million

 CNS Pharmaceuticals Reports Third Quarter 2026 Financial Results and Highlights Progress in Establishing Transformative Therapeutic Pipeline
 NuRAN Wireless Eliminates Floating-Price Preferred Overhang and Locks In a Fixed C$1.20 Conversion Price
 International Battery Metals Ltd. Reports Second Quarter of Fiscal Year 2027 Financial Results
 AsiaFIN Holdings Corp. Announces Third Quarter 2026 Results, Reporting Strong Nine-Month Financial Performance with Improved Margins

 Strategic Metals Reports Promising Results From the Rusty and Ranch Projects

 OBI Pharma Signs Collaboration and License Agreement with Novartis
 Blue Chip Capital Group Announces Quotation of its Common Stock on the OTCID and Updates Status of Initial Regulatory Compliance
 Emerging Growth Research Highlights Criticality of First Phosphate G7-Backed LFP Battery Onshoring Solution as Cleantech Sector Accelerates Post U.S. Midterms
 Sekur Private Data Ltd. Provides Update on Expected Closing of Non-Brokered Private Placement

 RenX Enterprises Reports Record Third Quarter Revenue of $4.49 Million, Up 27.6% Year Over Year
 Gladstone Capital Corporation Earnings Call and Webcast Information
 Wi2Wi Reports 35% Revenue Growth to US$2.36M and Returns to Profitability with US$268K Net Income in Q3 2026
 Westell Technologies, Inc. Announces Its Commencing a Tender Offer

 MicroVision Lidar Powers Commercial Driverless Trucking at Scale with Kodiak AI

 SMX: The Future of Gold Will Be Defined by What We Know About It -Powering Verified Trade and Tokenisation

 Big Mamma Founder Tigrane Seydoux Brings Italian Restaurant Group to Florida

-- Record annual revenue of $145.8 million, up 24.4 percent from prior year --
Fiscal Fourth Quarter Highlights
Gross profit increases to $5.2 million from $1.5 million a year ago.
Gross margin increases to 17.9 percent from 7.0 percent a year ago.
Revenue rises 35.6 percent to $29.3 million, despite approximately $3-4 million of shipments deferred to first quarter of fiscal 2026, due to delays at Haifa port.
FAIRFIELD, NJ / ACCESS Newswire / June 23, 2025 / Jerash Holdings (US), Inc. (NASDAQ:JRSH) (the "Company" or "Jerash"), which manufactures and exports custom, ready-made, sportswear and outerwear for leading global brands, today announced financial results for its fiscal 2025 fourth quarter and full year ended March 31, 2025.
"We are experiencing growing demand from our existing customers and a notable increase in new inquiries from brands and large apparel manufacturers seeking strategic collaboration," said Sam Choi, Jerash's chairman and chief executive officer. "As recently announced, Jerash secured a major initial order for one of the largest U.S.-based multinational and omnichannel retail corporations through a strategic collaboration with Hansoll Textile, a leading South Korea-based global apparel group.
"While this is an exciting time for Jerash on the business front, revenue continues to be impacted by logistics challenges at Israel's Haifa port, stemming from ongoing geopolitical turmoil in the region. In view of the recent bombing of the Haifa port, we are seeking alternate shipping routes through the Aqaba port in Jordan, which may delay shipments in the second half of June. Nevertheless, our business remain solid and on a growth trajectory. As we enter fiscal 2026, we are focused on improving operations and maintaining the positive momentum.
"On a positive note, the expansion of our existing manufacturing facilities has been completed, and we are in the process of bringing in additional foreign workers. A 15 percent increase in production capacity is expected to begin contributing to the Company's performance in the second fiscal quarter of 2026. At the present, our factories are fully booked through the end of December 2025," Choi added.
Outlook
Revenue for the fiscal 2026 first quarter is expected to be approximately $38-$40 million, pending outbound shipping port conditions.
Gross margin goal for fiscal 2026 first quarter is expected to be approximately 15-16 percent.
Fiscal 2025 Fourth Quarter Results
Fiscal 2025 fourth quarter revenue rose by 35.6 percent to $29.3 million from $21.6 million in the same quarter last year, primarily due to increases in shipments to Jerash's major customers in the U.S.
Gross profit advanced by nearly 250 percent to $5.2 million for the fiscal 2025 fourth quarter, from $1.5 million in the same quarter last year. Gross margin for fiscal 2025 fourth quarter increased to 17.9 percent, from 7.0 percent in the same period last year, primarily reflecting higher production and shipment volume, which lowered unit cost of production and generated higher margin through economy of scale.
Operating expenses increased by $284,000 to $4.8 million in the fiscal 2025 fourth quarter, compared with $4.5 million in the same quarter last year. This included a 4.7 percent increase in selling, general and administrative expenses due to higher sales and $83,000 increase in stock-based compensation.
Operating income was $434,000 for the fiscal 2025 fourth quarter, versus an operating loss of $3.0 million a year ago.
Total other expenses in the fiscal 2025 fourth quarter were $254,000, compared with $134,000 for the same quarter last year. The increase was primarily due to higher interest expenses from supply chain financing programs provided and short-term debt as a result of higher sales.
Net loss was reduced to $144,000, or $0.01 per share, for the fiscal 2025 fourth quarter, from a net loss of $3.1 million, or $0.25 per share, in the same period last year.
Comprehensive loss attributable to Jerash's common stockholders totaled $49,000 in the fiscal 2025 fourth quarter, compared with comprehensive loss of $3.4 million in the same quarter last year.
Fiscal 2025 Full Year Results
Revenue for the full 2025 fiscal year increased by 24.4 percent to a record high $145.8 million, from $117.2 million in fiscal 2024.
Gross profit for fiscal 2025 rose to $22.3 million, compared with $16.9 million in the prior fiscal year. Gross margin for fiscal 2025 improved to 15.3 percent from 14.4 percent in fiscal 2024.
Operating expenses in fiscal 2025 were $20.9 million, including stock-based compensation of $1.8 million, compared with $17.6 million in the prior fiscal year with stock-based compensation of $1.0 million. Operating income for fiscal 2025 improved to $1.4 million, from an operating loss of $665,000 in fiscal 2024.
Net loss for fiscal 2025 was reduced to $840,000, or $0.07 per share, from a net loss of $2.0 million, or $0.16 per share, last fiscal year.
Comprehensive loss attributable to Jerash's common stockholders was $869,000 in fiscal 2025, compared with comprehensive loss of $2.4 million in fiscal 2024.
Balance Sheet, Cash Flow and Dividends
Cash and restricted cash totaled $15.1 million, and net working capital was $34.6 million as of March 31, 2025.
On May 20, 2025, the board of directors of Jerash approved a regular quarterly dividend of $0.05 per share on the Company's common stock. The dividend was paid on June 6, 2025, to stockholders of record as of May 30, 2025.
Conference Call
Jerash Holdings will host an investor conference call to discuss its fiscal 2025 fourth quarter and full year results today, June 23, 2025, at 9:00 a.m. Eastern Time.
Phone: 888-506-0062 (domestic); 973-528-0011 (international)
Conference ID: 944776
A live and archived webcast will be available online in the investor relations section of Jerash's website at www.jerashholdings.com. For those who are not able to listen to the live broadcast, the call will be archived for approximately one year on the website.
About Jerash Holdings (US), Inc.
Jerash Holdings (US), Inc. manufactures and exports custom, ready-made, sportswear and outerwear for leading global brands and retailers, including VF Corporation (which owns brands such as The North Face, Timberland, and Vans), New Balance, G-III (which licenses brands such as Calvin Klein, Tommy Hilfiger, DKNY, and Guess), American Eagle, and Skechers. Jerash's existing production facilities comprise six factory units and four warehouses, and Jerash currently employs approximately 6,000 people. Additional information is available at www.jerashholdings.com.
Forward-Looking Statements
This news release contains forward-looking statements that involve risks and uncertainties, which may cause actual results to differ materially from the statements made. When used in this document, the words "may", "would", "could", "will", "intend", "plan", "anticipate", "believe", "estimate", "expect", "seek", "potential," "outlook" and similar expressions are intended to identify forward-looking statements. Such statements, including, but not limited to, Jerash's current views with respect to future events and its financial forecasts, and expansion of the customer base among high-profile global brands, are subject to such risks and uncertainties. Many factors could cause actual results to differ materially from the statements made, including those risks described from time to time in filings made by Jerash with the U.S. Securities and Exchange Commission. These and other risks and uncertainties are detailed in the Company's filings with the U.S. Securities and Exchange Commission. Should one or more of these risks or uncertainties materialize, or should assumptions underlying the forward-looking statements prove incorrect, actual results may vary materially from those described herein as intended, planned, anticipated or expected. Statements contained in this news release regarding past trends or activities should not be taken as a representation that such trends or activities will continue in the future. Jerash does not intend and does not assume any obligation to update these forward-looking statements, other than as required by law.
Contact:
PondelWilkinson Inc.
Judy Lin or Roger Pondel
310-279-5980; [email protected]
# # #
(tables below)
JERASH HOLDINGS (US), INC., AND SUBSIDIARIES
CONSOLIDATED STATEMENTS OF OPERATIONS AND COMPREHENSIVE LOSS
For the Three Months Ended March 31, | For the Fiscal Years Ended March 31, | |||||||||||
2025 | 2024 | 2025 | 2024 | |||||||||
(Unaudited) | (Unaudited) | |||||||||||
Revenue, net | $ | 29,251,426 | $ | 21,574,454 | $ | 145,812,006 | $ | 117,187,340 | ||||
Cost of goods sold | 24,012,525 | 20,073,952 | 123,492,561 | 100,284,991 | ||||||||
Gross Profit | 5,238,901 | 1,500,502 | 22,319,445 | 16,902,349 | ||||||||
Selling, general and administrative expenses | 4,464,351 | 4,262,721 | 19,114,456 | 16,581,256 | ||||||||
Stock-based compensation expenses | 341,035 | 258,350 | 1,758,146 | 986,048 | ||||||||
Total Operating Expenses | 4,805,386 | 4,521,071 | 20,872,602 | 17,567,304 | ||||||||
Income (loss) from Operations | 433,515 | (3,020,569 | ) | 1,446,843 | (664,955 | ) | ||||||
Other (Expense) Income: | ||||||||||||
Interest expenses | (371,469 | ) | (220,440 | ) | (1,719,760 | ) | (1,203,596 | ) | ||||
Other income, net | 117,667 | 86,493 | 424,108 | 499,120 | ||||||||
Total other expense, net | (253,802 | ) | (133,947 | ) | (1,295,652 | ) | (704,476 | ) | ||||
Net profit (loss) before provision for income taxes | 179,713 | (3,154,516 | ) | 151,191 | (1,369,431 | ) | ||||||
Income tax expenses (income) | 323,808 | (16,361 | ) | 991,120 | 672,495 | |||||||
Net loss | (144,095 | ) | (3,138,155 | ) | (839,929 | ) | (2,041,926 | ) | ||||
Net (gain) loss attributable to noncontrolling interest | (8,540 | ) | 49,397 | (8,440 | ) | 36,024 | ||||||
Net loss attributable to Jerash Holdings (US), Inc's Common Stockholders | $ | (152,635 | ) | $ | (3,088,758 | ) | $ | (848,369 | ) | $ | (2,005,902 | ) |
Net loss | $ | (144,095 | ) | $ | (3,138,155 | ) | $ | (839,929 | ) | $ | (2,041,926 | ) |
Other Comprehensive Income (Loss): | ||||||||||||
Foreign currency translation gain (loss) | 103,670 | (313,761 | ) | (20,803 | ) | (369,090 | ) | |||||
Total Comprehensive Loss | (40,425 | ) | (3,451,916 | ) | (860,732 | ) | (2,411,016 | ) | ||||
Comprehensive (gain) loss attributable to noncontrolling interest | (8,540 | ) | 49,397 | (8,440 | ) | 36,024 | ||||||
Comprehensive Loss Income Attributable to Jerash Holdings (US), Inc.'s Common Stockholders | $ | (48,965 | ) | $ | (3,402,519 | ) | $ | (869,172 | ) | $ | (2,374,992 | ) |
Loss Per Share Attributable to Common Stockholders: | ||||||||||||
Basic and diluted | $ | (0.01 | ) | $ | (0.25 | ) | $ | (0.07 | ) | $ | (0.16 | ) |
Weighted Average Number of Shares | ||||||||||||
Basic | 12,433,363 | 12,294,840 | 12,329,021 | 12,294,840 | ||||||||
Diluted | 12,433,363 | 12,294,840 | 12,329,021 | 12,294,840 | ||||||||
Dividend per share | $ | 0.05 | $ | 0.05 | $ | 0.20 | $ | 0.20 | ||||
JERASH HOLDINGS (US), INC. AND SUBSIDIARIES
CONSOLIDATED BALANCE SHEETS
March 31, 2025 | March 31, 2024 | |||
ASSETS | ||||
Current Assets: | ||||
Cash | $ | 13,346,791 | $ | 12,428,369 |
Accounts receivable, net | 3,076,074 | 5,417,513 | ||
Inventories | 27,704,829 | 27,241,573 | ||
Prepaid expenses and other current assets | 3,648,321 | 2,746,068 | ||
Advances to suppliers, net | 6,644,194 | 3,086,137 | ||
Total Current Assets | 54,420,209 | 50,919,660 | ||
Restricted cash - non-current | 1,717,248 | 1,608,498 | ||
Long-term deposits | 464,934 | 802,306 | ||
Deferred tax assets, net | - | 158,329 | ||
Property, plant, and equipment, net | 25,023,681 | 24,998,096 | ||
Goodwill | 499,282 | 499,282 | ||
Operating lease right of use assets | 850,172 | 1,259,395 | ||
Total Assets | $ | 82,975,526 | $ | 80,245,566 |
LIABILITIES AND EQUITY | ||||
Current Liabilities: | ||||
Credit facilities | $ | 4,512,462 | $ | - |
Accounts payable | 6,507,308 | 6,340,237 | ||
Accrued expenses | 4,342,436 | 4,175,843 | ||
Income tax payable - current | 1,305,386 | 1,647,199 | ||
Uncertain tax provision | 175,290 | - | ||
Other payables | 2,149,185 | 2,234,870 | ||
Deferred revenue | 487,004 | 10,200 | ||
Operating lease liabilities - current | 339,699 | 370,802 | ||
Total Current Liabilities | 19,818,770 | 14,779,151 | ||
Deferred tax liabilities, net | 120 | - | ||
Operating lease liabilities - non-current | 287,527 | 618,302 | ||
Income tax payable - non-current | - | 417,450 | ||
Total Liabilities | 20,106,417 | 15,814,903 | ||
Equity | ||||
Preferred stock, $0.001 par value; 500,000 shares authorized; none issued and outstanding | $ | - | $ | - |
Common stock, $0.001 par value; 30,000,000 shares authorized; 12,939,418 and 12,534,318 shares issued; 12,699,940 and 12,294,840 shares outstanding as of March 31, 2025 and 2024, respectively | 12,939 | 12,534 | ||
Additional paid-in capital | 25,674,835 | 23,917,094 | ||
Treasury stock, 239,478 shares | (1,169,046 | ) | (1,169,046 | ) |
Statutory reserve | 413,821 | 413,821 | ||
Retained earnings | 38,396,901 | 41,704,238 | ||
Accumulated other comprehensive loss | (513,122 | ) | (492,319 | ) |
Total Jerash Holdings (US), Inc. Stockholders' Equity | 62,816,328 | 64,386,322 | ||
Noncontrolling interest | 52,781 | 44,341 | ||
Total Equity | 62,869,109 | 64,430,663 | ||
Total Liabilities and Equity | $ | 82,975,526 | $ | 80,245,566 |
JERASH HOLDINGS (US), INC. AND SUBSIDIARIES
CONSOLIDATED STATEMENTS OF CASH FLOWS
For the Fiscal Years Ended March 31, | ||||||
2025 | 2024 | |||||
CASH FLOWS FROM OPERATING ACTIVITIES | ||||||
Net loss | $ | (839,929 | ) | $ | (2,041,926 | ) |
Adjustments to reconcile net loss to net cash provided by operating activities: | ||||||
Depreciation | 2,681,709 | 2,539,736 | ||||
Stock-based compensation expenses | 1,758,146 | 986,048 | ||||
Credit loss recovery, net | (17,054 | ) | (187,762 | ) | ||
Amortization of operating lease right-of-use assets | 591,961 | 759,764 | ||||
Uncertain tax provision | 175,290 | - | ||||
Changes in operating assets: | ||||||
Accounts receivable | 2,358,493 | (2,989,214 | ) | |||
Bills receivable | - | 87,573 | ||||
Inventories | (463,257 | ) | 5,415,260 | |||
Prepaid expenses and other current assets | (902,253 | ) | 187,140 | |||
Advance to suppliers | (3,558,057 | ) | (1,553,046 | ) | ||
Deferred tax assets | 158,329 | (4,456 | ) | |||
Changes in operating liabilities: | ||||||
Accounts payable | 167,071 | 557,667 | ||||
Accrued expenses | 166,593 | 1,245,310 | ||||
Other payables | (85,685 | ) | 757,627 | |||
Deferred revenue | 476,804 | (918,193 | ) | |||
Operating lease liabilities | (544,616 | ) | (824,043 | ) | ||
Income tax payable | (759,037 | ) | (1,532,944 | ) | ||
Deferred tax liabilities | 120 | - | ||||
Net cash provided by operating activities | 1,364,628 | 2,484,541 | ||||
CASH FLOWS FROM INVESTING ACTIVITIES | ||||||
Purchases of property, plant and equipment | (951,112 | ) | (1,241,226 | ) | ||
Payments for construction of properties | (1,089,484 | ) | (3,600,948 | ) | ||
Payment for long-term deposits | (329,326 | ) | (300,762 | ) | ||
Net cash used in investing activities | (2,369,922 | ) | (5,142,936 | ) | ||
CASH FLOWS FROM FINANCING ACTIVITIES | ||||||
Dividend payments | (2,458,968 | ) | (2,458,968 | ) | ||
Investment of noncontrolling interest | - | 31,365 | ||||
Repayment from short-term loan | (14,103,935 | ) | (7,545,829 | ) | ||
Proceeds from short-term loan | 18,616,397 | 7,545,829 | ||||
Net cash provided by (used in) financing activities | 2,053,494 | (2,427,603 | ) | |||
EFFECT OF EXCHANGE RATE CHANGES ON CASH AND RESTRICTED CASH | (21,028 | ) | (288,738 | ) | ||
NET INCREASE (DECREASE) IN CASH AND RESTRICTED CASH | 1,027,172 | (5,374,736 | ) | |||
CASH, AND RESTRICTED CASH, BEGINNING OF THE YEAR | 14,036,867 | 19,411,603 | ||||
CASH, AND RESTRICTED CASH, END OF THE YEAR | $ | 15,064,039 | $ | 14,036,867 | ||
CASH, AND RESTRICTED CASH, END OF THE YEAR | $ | 15,064,039 | $ | 14,036,867 | ||
LESS: NON-CURRENT RESTRICTED CASH | 1,717,248 | 1,608,498 | ||||
CASH, END OF THE YEAR | $ | 13,346,791 | $ | 12,428,369 | ||
Supplemental disclosure information: | ||||||
Cash paid for interest | $ | 1,719,760 | $ | 1,203,596 | ||
Income tax paid | $ | 1,398,684 | $ | 2,253,410 | ||
Non-cash investing and financing activities | ||||||
Equipment obtained by utilizing long-term deposit | $ | 667,567 | $ | 354,917 | ||
Operating lease right of use assets obtained in exchange for operating lease obligations | $ | 186,726 | $ | 1,058,820 | ||
SOURCE: Jerash Holdings (US), Inc.
View the original press release on ACCESS Newswire
P.Smith--AT