Pro-Dex, Inc. Announces Fiscal 2025 Fourth Quarter and Full-Year Results

 Part of London's Oxford Street pedestrianised 'forever'

 Canadian youth seek climate action in landmark trial

 Trump blasts Norway over Nobel Peace Prize snub

 Japan PM vows swift response to wave of cyberattacks

 Stocks mostly rise before tech earnings, central bank calls

 France's Macron to visit Marseille after protest violence

 German union slams Audi boss's appearance at Trump rally

 UK set for 'limited' budget giveaways as borrowing costs surge

 Anthropic's AI model accessed US voter data: Axios

 Malaysia's Johor reopens schools as haze eases

 Carragher says Fernandes benching was intended as public punishment

 Canada-EU summit seeks deepened alliance as US ties fray

 Senegal to host Youth Games, Africa's first ever Olympics

 ITV drama Adultery examines temptation, class and family consequences

 New levy on non-EU parcels kicks in November 1

 Saudi coalition says struck Houthi missile facilities after Riyadh airport attack

 Manchester United stand-in captain calls for change after Bournemouth loss

 Body recovered after ferry passenger reported overboard

 Dance in the Dark brings an immersive family adventure to Birmingham MAC

 China's Communist Party elite hold key talks on governance

 Redditch Santa fun run to return to Arrow Valley Park

 Obama links Trump trade policy to higher costs in Detroit speech

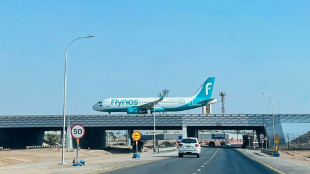 Saudi coalition says intercepted missile after Houthis hit Riyadh airport

 'I feel so happy!': Ecstasy, relief among Brazil's Lula supporters

 Brazil's Lula clinches poll victory, Bolsonaro seeks to annul election

IRVINE, CA / ACCESS Newswire / September 4, 2025 / PRO-DEX, INC. (NasdaqCM:PDEX) today announced financial results for its fiscal 2025 fourth quarter and full-year ended June 30, 2025.
Quarter Ended June 30, 2025
Net sales for the three months ended June 30, 2025 increased $2.5 million, or 16%, to $17.5 million from $15.0 million for the three months ended June 30, 2024, due primarily to increased revenue to our top three customers. Grossprofit for the threemonths ended June 30, 2025 decreased $599,000, or 15%. Our gross margin decreased from 27% for the three months ended June 30, 2024, to 20% for the three months ended June 30, 2025, due to unfavorable product mix, and higher indirect manufacturing costs including the initial wave of tariff costs. During much of the fourth quarter we were shipping our largest customer their legacy product but, late in the fourth quarter, we resumed production and shipment of their next generation handpiece as they released their product hold and returned us to full production.
Operating expenses (which include selling, general and administrative, and research and development expenses) for the quarter ended June 30, 2025, increased $409,000 to $2.1 million, compared to $1.7 million for the prior fiscal year's corresponding quarter. We have increased selling expenses by $96,000, general and administrative expenses by $244,000 and engineering expenses by $69,000 for the quarter ended June 30, 2025, compared to the corresponding quarter in 2024. Increases relate primarily to increased personnel costs in each of these areas to support our continued growth.
Our operating income for the quarter ended June 30, 2025, decreased $1.0 million, or 43%, to $1.3 million compared to $2.3 million for the prior fiscal year's corresponding quarter. The decrease reflects our decreased gross profit and higher operating expenses, as described above.
Net income for the quarter ended June 30, 2025, decreased by $391,000 to $1.2 million, or $0.36 per diluted share, compared to $1.6 million, or $0.46 per diluted share, in the corresponding quarter in 2024.
Year Ended June 30, 2025
Net sales for the fiscal year ended June 30, 2025 increased $12.8 million, or 24%, to $66.6 million from $53.8 million for the fiscal year ended June 30, 2024, due primarily to increases in revenue from our largest customer. Specifically, the increase relates to $12.0 million in sales of the next generation handpiece to that same customer.
Gross profit forthe fiscal year ended June 30, 2025, increased $5.0 million, or 34%, to $19.5 million compared to $14.5 million for fiscal 2024. Our gross margin increased from 27% in fiscal 2024 to 29% in fiscal 2025, due to overall favorable product mix (notwithstanding the unfavorable product mix during the fourth quarter described above).
Operating expenses (which include selling, general and administrative, and research and development expenses) for the fiscal year ended June 30, 2025, increased $1.4 million or 20% to $8.8 million from $7.4 million in the prior fiscal year. The increase relates primarily to an increase in personnel costs in selling, and general and administrative expenses to support our continued growth. The increase in research and development expenses in fiscal 2025 is primarily related to an increase in internal product development projects compared to fiscal 2024.
Our operating income for the year ended June 30, 2025, increased $3.5 million, or 49%, to $10.7 million compared to $7.2 million for the prior fiscal year's corresponding quarter. The increase reflects our increased sales and gross profit, as described above.
Net income for the fiscal year ended June 30, 2025, was $9.0 million, or $2.67 per diluted share, compared to $2.1 million, or $0.60 per diluted share, for fiscal 2024. Our net income for the year ended June 30, 2025, contains unrealized gains on our marketable equity investments of $1.5 million while our net income for the year ended June 30, 2024, contains unrealized losses on our marketable equity investments of $4.1 million. The difference in the growth rate of net income and operating income is primarily due to unrealized gains and losses of investments. All of our investments are recorded at estimated fair value, and the valuation can be highly volatile.
CEO Comments
"We are very pleased with our fiscal 2025 performance including increasing sales by 24% and an increase of $3.5 million in operating income." said the Company's President and Chief Executive Officer Richard L. ("Rick") Van Kirk. "While this fiscal year included disruption in transitioning to our largest customer's next generation handpiece, we continued to meet our customers' requests by nimbly shifting assembly schedules to their requested mix of legacy and new product." Mr. Van Kirk continued, "Additionally, we expect fiscal 2026 to continue our trend of revenue and operating income growth, especially as evidenced by our June 30th backlog in the amount of $50.4 million. We have also begun working with customers on sharing of tariff costs and are also excited about added depth in our management team and improvements being made to our manufacturing systems."
About Pro-Dex, Inc.:
Pro-Dex, Inc. specializes in the design, development, and manufacture of autoclavable, battery-powered, and electric multi-function surgical drivers and shavers used primarily in the orthopedic, thoracic, and maxocranial facial markets. We have patented adoptive torque-limiting software and proprietary sealing solutions which appeal to our customers, primarily medical device distributors. Pro-Dex also sells rotary air motors, however, these motors represent a de minimis portion of total revenue. Pro-Dex's products are found in hospitals and medical engineering labs around the world. For more information, visit the Company's website at www.pro-dex.com.
Statements herein concerning the Company's plans, growth and strategies may include "forward-looking statements" within the context of the federal securities laws. Statements regarding the Company's future events, developments and future performance (including, but not limited to, prospects for future growth and ability to share tariff costs with customers) as well as management's expectations, beliefs, plans, estimates, or projections relating to the future, are forward-looking statements within the meaning of these laws. The Company's actual results may differ materially from those suggested as a result of various factors. Interested parties should refer to the disclosure concerning the operational and business risks of the Company set forth in the Company's filings with the Securities and Exchange Commission.
(tables follow)
PRO-DEX, INC. AND SUBSIDIARY
CONSOLIDATED BALANCE SHEETS
(In thousands, except share data)
June 30, | ||||||
2025 | 2024 | |||||
ASSETS | ||||||
Current assets: | ||||||
Cash and cash equivalents......................................................... | $ | 419 | $ | 2,631 | ||
Investments............................................................................. | 6,740 | 4,217 | ||||
Accounts receivable................................................................. | 16,433 | 13,887 | ||||
Deferred costs.......................................................................... | 24 | 262 | ||||
Inventory....................................................................................... ... | 22,213 | 15,269 | ||||
Income taxes receivable............................................................ | 1,056 | - | ||||
Prepaid expenses...................................................................... | 410 | 345 | ||||
Total current assets............................................................ | 47,295 | 36,611 | ||||
Land and building, net................................................................... | 6,061 | 6,155 | ||||
Equipment and improvements, net.................................................. | 5,153 | 5,024 | ||||
Right of use asset, net..................................................................... | 1,050 | 1,473 | ||||
Intangibles, net.............................................................................. | 26 | 54 | ||||
Deferred income taxes, net............................................................. | 1,415 | 1,555 | ||||
Investments................................................................................... | 148 | 1,563 | ||||
Other assets................................................................................... | 44 | 42 | ||||
Total assets........................................................................ | $ | 61,192 | $ | 52,477 | ||
LIABILITIES AND SHAREHOLDERS' EQUITY | ||||||
Current liabilities: | ||||||
Accounts payable.................................................................... | $ | 4,614 | $ | 4,513 | ||
Accrued liabilities.................................................................... | 3,479 | 3,359 | ||||
Income taxes payable.............................................................. | 186 | 632 | ||||
Deferred revenue..................................................................... | 202 | 14 | ||||
Notes payable......................................................................... | 6,148 | 4,374 | ||||
Total current liabilities....................................................... | 14,629 | 12,892 | ||||
Non-current liabilities: | ||||||
Lease liability, net of current portion........................................ | 685 | 1,182 | ||||
Notes payable, net of current portion........................................ | 9,246 | 7,536 | ||||
Total non-current liabilities................................................. | 9,931 | 8,718 | ||||
Total liabilities................................................................... | 24,560 | 21,610 | ||||
Commitments and Contingencies: | ||||||
Shareholders' equity: | ||||||
Common stock, no par value, 50,000,000 shares authorized; 3,261,043 and 3,363,412 shares issued and outstanding at June 30, 2025 and 2024, respectively............................... | 704 | 3,917 | ||||
Retained earnings..................................................................... | 35,928 | 26,950 | ||||
Total shareholders' equity.................................................. | 36,632 | 30,867 | ||||
Total liabilities and shareholders' equity.............................. | $ | 61,192 | $ | 52,477 | ||
PRO-DEX, INC. AND SUBSIDIARY
CONSOLIDATED INCOME STATEMENTS
(In thousands, except per share data)
Three Months Ended June 30, (Unaudited) | Years Ended | |||||||||||
2025 | 2024 | 2025 | 2024 | |||||||||
Net sales.................................................. | $ | 17,494 | $ | 15,025 | $ | 66,593 | $ | 53,844 | ||||
Cost of sales ............................................ | 14,004 | 10,936 | 47,083 | 39,293 | ||||||||
Gross profit.............................................. | 3,490 | 4,089 | 19,510 | 14,551 | ||||||||
Operating expenses: Selling expenses..................................... | 133 | 37 | 344 | 117 | ||||||||
General and administrative expenses........ | 1,108 | 864 | 4,841 | 4,072 | ||||||||
Research and development costs.............. | 905 | 836 | 3,636 | 3,189 | ||||||||
Total operating expenses........................... | 2,146 | 1,737 | 8,821 | 7,378 | ||||||||
Operating income..................................... | 1,344 | 2,352 | 10,689 | 7,173 | ||||||||
Interest expense........................................ | (226 | ) | (150 | ) | (829 | ) | (558 | ) | ||||
Unrealized gain (loss) on investments........ | 460 | (340 | ) | 1,521 | (4,125 | ) | ||||||
Gain on sale of investments....................... | - | - | 595 | - | ||||||||
Interest and dividend income..................... | 21 | 68 | 82 | 144 | ||||||||
Income before income taxes...................... | 1,599 | 1,930 | 12,058 | 2,634 | ||||||||
Income tax expense.................................. | 403 | 343 | 3,080 | 507 | ||||||||
Net income............................................... | $ | 1,196 | $ | 1,587 | $ | 8,978 | $ | 2,127 | ||||
Basic & Diluted income per share: | ||||||||||||
Basic net income per share.................... | $ | 0.37 | $ | 0.47 | $ | 2.73 | $ | 0.61 | ||||
Diluted net income per share.................. | $ | 0.36 | $ | 0.46 | $ | 2.67 | $ | 0.60 | ||||
Weighted average shares outstanding: | ||||||||||||
Basic................................................. | 3,261,043 | 3,400,767 | 3,287,844 | 3,498,807 | ||||||||
Diluted.............................................. | 3,350,449 | 3,473,167 | 3,361,207 | 3,571,207 | ||||||||
PRO-DEX, INC. AND SUBSIDIARY
CONSOLIDATED STATEMENTS OF CASH FLOWS
(In thousands)
Years Ended June 30, | ||||||
2025 | 2024 | |||||
CASH FLOWS FROM OPERATING ACTIVITIES: | ||||||
Net income............................................................................................ | $ | 8.978 | $ | 2,127 | ||
Adjustments to reconcile net income to net cash provided by (used in) operating activities: | ||||||
Depreciation and amortization............................................................. | 1,239 | 1,160 | ||||
Unrealized (gain) loss on marketable equity investments....................... | (1,521 | ) | 4,125 | |||
Gain on sale of investments................................................................. | (595 | ) | - | |||
Non-cash lease recovery...................................................................... | (33 | ) | (17 | ) | ||
Amortization of loan fees, net.............................................................. | 9 | 12 | ||||
Share-based compensation................................................................... | 555 | 605 | ||||
Deferred income taxes......................................................................... | 140 | (1,563 | ) | |||
Changes in operating assets and liabilities: | ||||||
Accounts receivable........................................................................ | (2,546 | ) | (3,935 | ) | ||
Deferred costs................................................................................. | 238 | 232 | ||||
Inventory........................................................................................ | (6,944 | ) | 898 | |||
Prepaid expenses and other assets..................................................... | (67 | ) | (49 | ) | ||
Accounts payable and accrued expenses........................................... | 179 | 2,436 | ||||
Deferred revenue............................................................................. | 188 | 14 | ||||
Income taxes................................................................................... | (1,502 | ) | 179 | |||
Net cash provided by (used in) operating activities................................... | (1,682 | ) | 6,224 | |||
CASH FLOWS FROM INVESTING ACTIVITIES: | ||||||
Purchases of equipment and improvements........................................... | (1,246 | ) | (983 | ) | ||
Proceeds from sale of investments ...................................................... | 1,907 | - | ||||
Investment in Monogram.................................................................... | (899 | ) | (1,250 | ) | ||
Net cash used in investing activities......................................................... | (238 | ) | (2,233 | ) | ||
CASH FLOWS FROM FINANCING ACTIVITIES: | ||||||
Principal payments on notes payable.................................................... | (11,528 | ) | (4,841 | ) | ||
Borrowing from Minnesota Bank & Trust,........................................... | 15,003 | 4,000 | ||||
Repurchases of common stock............................................................. | (3,504 | ) | (3,505 | ) | ||
Payments of employee taxes on net issuance of common stock.............. | (305 | ) | - | |||
Proceeds from exercise of stock options and ESPP contributions........... | 42 | 50 | ||||
Net cash used in financing activities........................................................ | (292 | ) | (4,296 | ) | ||
Net increase (decrease) in cash and cash equivalents................................. | (2,212 | ) | (305 | ) | ||
Cash and cash equivalents, beginning of year........................................... | 2,631 | 2,936 | ||||
Cash and cash equivalents, end of year.................................................... | $ | 419 | $ | 2,631 | ||
Contact:
Richard L. Van Kirk, Chief Executive Officer
(949) 769-3200
SOURCE: Pro-Dex, Inc.
View the original press release on ACCESS Newswire
G.P.Martin--AT