
Coca-Cola Europacific Partners Plc Announces Results for The Six Months Ended 27 June 2025

 Miranda Lambert Leads North Texans with Seven Grammy Nominations for 2027

 Smart Car Seats Tested: Do Sensors and Apps Actually Improve Safety?

 RuffleButts + RuggedButts Featured in Hasbro's 2026 Holiday Gift Guide

 NexCore and MetLife Investment Management Launch $1.3 Billion Senior Living Co-Investment Venture

 Glidewell Opens Applications for 2027 Guiding Leaders Cohorts in California and North Carolina

 Valion Bio Reports Completion of 200-Liter Entolimod Production Run; Material Supplying Ongoing AFRRI Study

 Klique Joins Lenovo AI Innovators, Bringing Its Enterprise AI Control Plane to Lenovo Hybrid AI Factory
 FaZe Esports, a GameSquare Company, Wins Rainbow Six Championship at Osaka Major

 BioLargo Reports Third Quarter 2026 Results, Forecasting Commercial Breakout in 2027

 Nexscient Reports Third Quarter 2026 Results; Revenue Rises Sequentially as Gross Margin Expands to Over 40%

 Ur-Energy Commences Baseline Study Fieldwork; Nears Completion of Technical Report at Lost Soldier Uranium Project, Wyoming

 Pilot-Founded Solara Global Jet Offers Charter, Leases and Air Cargo Nationwide and Overseas
 InterContinental Hotels Group PLC Announces Transaction in Own Shares - November 17
 Broad Clinical Labs Drives Strong Digital Engagement by Connecting Customers with Published Research Through Bioz

 ImageWorks Display Advances Whole-Store Solutions with a Re-Imagined Planniq Strong and Planniq Chill
 Pivotree Announces Third Quarter 2026 Results

 Gabriel Resources Provides Corporate and Financing Update

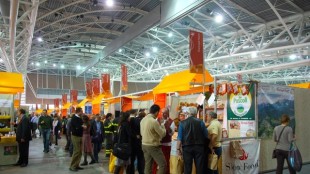 Galway Metals Intersects 1.8 g/t Gold Over 25.0 Metres and 0.7 g/t Gold Over 66.0 Metres at Clarence Stream

 Brightline Interactive and TruWeather Solutions Sign MOU to Bring Weather Data into SpatialCore Physical AI Platform

 RMTG Expands Cellular Hope Institute's Cancún Clinical Facilities and Longevity Platform

 Wedgewood Weddings Brings Creekside Mountain Celebrations to Idaho Springs with Blackstone Rivers
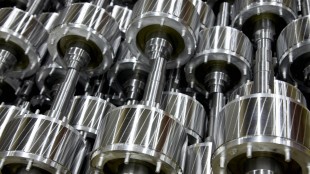
 FibreSeek Expands U.S. Availability of FibreSeeker 3 with Local Stock and Fulfillment
Islo Secures $15 Million Investment Led by Insight Partners to Scale Enterprise Software Factory Platform
Join Nord Precious Metals' Live Investor Webinar: Advancing Silver Production and High-Grade Exploration in Ontario

 BHG Financial Closes a New ABS Transaction of $495 Million

UXBRIDGE, ENGLAND / ACCESS Newswire / August 6, 2025 / Solid first half; reaffirming full-year profit & cash guidance
H1 2025 Total CCEP Key Financial Metrics[1] | As Reported | Comparable [1] | Change vs H1 2024 | Adjusted Comparable[4] | Change vs H1 2024 | |||
As Reported | Comparable [1] | Comparable FXN[1] | Adjusted Comparable[4] | Adjusted Comparable FXN[4] | ||||
Volume (M UC)[2] | 1,932 | 1,932 | 4.1% | 5.5% | 1,932 | 0.3% | ||
Revenue per UC[2] (€) | 5.36 | 1.1% | 5.36 | 3.8% | ||||
Revenue (€M) | 10,274 | 10,274 | 4.5% | 4.5% | 5.3% | 10,274 | 1.8% | 2.5% |
Operating profit (€M) | 1,364 | 1,390 | 19.4% | 7.3% | 8.0% | 1,390 | 6.4% | 7.2% |
Diluted EPS (€) | 1.99 | 2.02 | 15.0% | 2.4% | 3.1% | |||
Comparable free cash flow (€M) | 425 | |||||||
Interim dividend per share (€) | 0.79 | |||||||
DAMIAN GAMMELL, CHIEF EXECUTIVE OFFICER, SAID:
"We're pleased to have delivered a solid first half performance. This reflects our great brands, great people, great execution and strong relationships with our brand partners and customers. We've continued to grow share ahead of the market, create value for our customers, and deliver solid gains in revenue per unit case through revenue and margin growth management.
"In Europe, Easter timing, better weather and performance in Away from Home supported a return to volume growth in Q2. Total first half volumes were impacted by a weaker consumer backdrop in Indonesia, however we remain excited about the long-term opportunity and continue to focus on our transformation journey. Our other APS markets performed well.
"Given our year-to-date performance, strong commercial plans for the balance of the year, continued focus on productivity and a good start to the second half, we are pleased to be reaffirming our full-year profit and cash guidance. While the global macroeconomic environment is volatile, we remain resilient. Our leading market positions in growing categories across our 31 locally driven markets continue to support our performance.
"Our first half interim dividend and ongoing share buybacks demonstrate the strength of our business and our ability to deliver continued shareholder value. Strong cash generation is supporting record investment in future growth. This includes unlocking more value with technology and AI, as showcased at our recent investor event. We're confident we have the right strategy, done sustainably to deliver on our mid-term growth objectives."
___________________________
Note: All footnotes included alongside the 'About CCEP' section
*Comparable volume movements adjust for the impact of selling day movements, with two fewer selling days in H1'25 versus H1'24
H1 Financial Summary | ||||||||||
H1 2025 Metric[1] | As Reported | Comparable[1] | Change vs H1 2024 | Adjusted Comparable[4] | Change vs H1 2024 | |||||
As Reported | Comparable [1] | Comparable FXN[1] | Adjusted Comparable[4] | Adjusted Comparable FXN[4] | ||||||
Total CCEP | ||||||||||
Volume (M UC)[2] | 1,932 | 1,932 | 4.1% | 5.5% | 1,932 | 0.3% | ||||
Revenue (€M) | 10,274 | 10,274 | 4.5% | 4.5% | 5.3% | 10,274 | 1.8% | 2.5% | ||
Cost of sales (€M) | 6,637 | 6,643 | 4.8% | 5.1% | 5.8% | 6,643 | 1.7% | 2.4% | ||
Operating profit (€M) | 1,364 | 1,390 | 19.4% | 7.3% | 8.0% | 1,390 | 6.4% | 7.2% | ||
Profit after taxes (€M) | 937 | 951 | 15.5% | 2.9% | 3.7% | |||||
Diluted EPS (€) | 1.99 | 2.02 | 15.0% | 2.4% | 3.1% | |||||
Revenue per UC[2] (€) | 5.36 | 1.1% | 5.36 | 3.8% | ||||||
Cost of sales per UC[2] (€) | 3.46 | 1.6% | 3.46 | 3.6% | ||||||
Comparable free cash flow (€M) | 425 | |||||||||
Interim dividend per share* (€) | 0.79 | |||||||||
Europe | ||||||||||
Volume (M UC)[2] | 1,246 | 1,246 | (1.9)% | (0.3)% | 1,246 | (0.3)% | ||||
Revenue (€M) | 7,471 | 7,471 | 2.6% | 2.6% | 2.3% | 7,471 | 2.6% | 2.3% | ||
Operating profit (€M) | 1,070 | 1,053 | 21.3% | 7.6% | 7.2% | 1,053 | 7.6% | 7.2% | ||
Revenue per UC[2] (€) | 5.98 | 4.2% | 5.98 | 4.2% | ||||||
APS (Australia, Pacific & Southeast Asia) | ||||||||||
Volume (M UC)[2] | 686 | 686 | 17.1% | 18.1% | 686 | 1.5% | ||||
Revenue (€M) | 2,803 | 2,803 | 10.0% | 10.0% | 13.9% | 2,803 | (0.5)% | 3.1% | ||
Operating profit (€M) | 294 | 337 | 13.1% | 6.3% | 10.7% | 337 | 3.1% | 7.3% | ||
Revenue per UC[2] (€) | 4.23 | (2.6)% | 4.23 | 3.2% | ||||||
*First half interim dividend per share of €0.79 (declared at Q1 & paid in May), calculated as 40% of the FY24 dividend
H1 & Q2 Revenue Highlights[1],[4]
H1 Revenue: Reported +4.5%; Adjusted Comparable FXN +2.5%[4]
• A leading value creator, delivering solid revenue growth for retail customers in our key markets compared to FMCG peers
• NARTD YTD value share[5] +10bps in-store & broadly flat online
• Transactions growing ahead of volumes in Europe; behind in APS impacted by Indonesia
• Adjusted comparable volume +0.3%[4],[6] reflecting great in-market execution
- By geography:
◦ Europe -0.3% (slightly ahead excl. Capri Sun) reflects solid growth in Q2, offset by impact of French sugar tax & strategic de-listing of Capri Sun (now annualised)
◦ APS +1.5% reflecting:
▪ Australia/Pacific (AP): mid-single digit increase driven by Australia & the Pacific Islands
▪ Southeast Asia (SEA): volumes broadly flat with continued growth in the Philippines (cycling H1'24 +17%) offset by decline in Indonesia reflecting a weaker consumer backdrop
- By channel:
Away from Home (AFH) +0.4%, Home +0.1%
◦ Europe: AFH +1.1% (Q1: +0.6%), Home -1.1% (Q1: -3.6%)
◦ APS: AFH -0.3% (Q1: +0.9%), Home +5.0% (Q1: +4.5%)
▪ Adjusted comparable revenue per unit case +3.8%[2],[3],[4] driven by positive headline pricing, promotional optimisation & positive pack mix
◦ Europe: +4.2% reflecting headline price increases in France, Iberia & GB with annualisation of H2'24 pricing in Germany
◦ APS: 3.2% reflecting headline price increases & promotional optimisation in Australia
Q2 Revenue: Reported +4.1%; Adjusted Comparable FXN +5.4%[4]
• Adjusted comparable volume +1.1%[4],[6] reflecting great in-market execution
- By geography:
◦ Europe +1.2% reflecting later Easter timing & better weather in several markets
◦ APS +0.9% reflecting:
▪ AP: continued solid underlying momentum
▪ SEA: low single-digit decline driven by double-digit volume decline in Indonesia, largely reflecting a weaker consumer backdrop, more than offsetting Philippines growth (cycling Q2'24 +18%)
- By channel: AFH +0.1%, Home +1.8%
◦ Europe: AFH +1.4%; Home +1.1%
◦ APS: AFH -1.4%, Home +5.6%
▪ Adjusted comparable revenue per unit case +4.3%[2],[3],[4] driven by positive headline pricing, promotional optimisation & brand mix
◦ Europe: +4.2% reflecting Q1 headline price increases (France & Iberia) & GB in Q2
◦ APS: +4.4% reflecting headline price increases & promotional optimisation
VOLUMES NOTE - Year on year volume movements are disclosed on a comparable and adjusted comparable basis which (i) assumes the acquisition of Coca-Cola Beverages Philippines, Inc. occurred at the beginning of the comparative period & (ii) adjusts for the impact of two fewer selling days versus H1'24
Excluding selling days adjusted H1'25 volumes were CCEP -1.3% (Europe -1.9%, APS -0.1%)
H1 Operating Profit, Other Highlights & FY25 Guidance[1]
H1 Operating profit: Reported +19.4%; Adjusted Comparable FXN +7.2%[4]
Adjusted comparable cost of sales per unit case +3.6%[2],[3],[4] as expected, reflecting increased revenue per unit case driving higher concentrate costs, inflation in manufacturing & tax increases in France & GB
Adjusted comparable operating profit of €1,390m, +7.2%[3],[4] reflecting top-line growth & ongoing productivity & efficiency programmes. Reported operating profit of €1,364m, +19.4% reflecting lower business transformation costs
Comparable diluted EPS of €2.02, +3.1%[3] (reported €1.99, +15.0%)
Other
• Comparable free cash flow: generated solid comparable free cash flow of €425m reflecting solid performance (net cash flows from operating activities of €986m)
• Following the transfer of CCEP's UK listing to the Equity Shares (Commercial Companies) category in November 2024, CCEP entered the FTSE UK Index Series in March 2025
• Sustainability highlights:
◦ Carbon Disclosure Project's A list for Climate - 9th consecutive year
◦ Sustainalytics ESG top-rated companies list for 2025
FY25 guidance[1],[4]
Outlook for FY25 reflects our current assessment of market conditions. Unless stated otherwise, guidance is on an adjusted comparable[4] & FX-neutral basis.
(Based on current spot rates, FX represents a full year headwind of ~150 basis points to revenue & ~200 basis points to operating profit)
• Revenue: growth of 3% to 4% (previously ~4%)
◦ Two fewer selling days in Q1, one extra in Q4
▪ Cost of sales per UC: comparable growth of ~2%
◦ Expect broadly flat commodity inflation (hedged at ~95% for FY25)
◦ Concentrate directly linked to revenue per UC through incidence pricing
▪ Operating profit: growth of ~7%
▪ Comparable effective tax rate: ~26%
▪ CAPEX: ~5% of revenue (incl. leases)
▪ Comparable free cash flow: at least €1.7bn
▪ Dividend payout ratio: ~50%[7] based on comparable EPS
▪ Share buyback: €1bn over 12 months from February 2025 (~€460m now completed)[14]
SECOND QUARTER & FIRST HALF REVENUE PERFORMANCE BY GEOGRAPHY[1]
All values are unaudited and all references to volumes are on a comparable basis for Europe and Australia / Pacific, and on an adjusted comparable basis for SEA, total APS and total CCEP. All changes are versus prior year equivalent period unless stated otherwise.
Second Quarter | First Half | |||||
Fx-Neutral | Fx-Neutral | |||||
€ million | % change | % change | € million | % change | % change | |
FBN[8] | 1,506 | 8.9% | 8.5% | 2,672 | 3.8% | 3.6% |
Germany | 861 | 3.2% | 3.2% | 1,547 | 0.5% | 0.5% |
Great Britain | 938 | 7.8% | 7.2% | 1,697 | 6.5% | 5.0% |
Iberia[9] | 913 | 1.2% | 1.2% | 1,555 | (1.0)% | (1.0)% |
Total Europe | 4,218 | 5.7% | 5.5% | 7,471 | 2.6% | 2.3% |
Australia / Pacific[11] | 772 | 1.8% | 10.3% | 1,613 | 0.1% | 5.1% |
Southeast Asia[4],[12] | 595 | (3.4)% | (0.8)% | 1,190 | (1.2)% | 0.3% |
Total APS[4] | 1,367 | (0.5)% | 5.3% | 2,803 | (0.5)% | 3.1% |
Total CCEP[4] | 5,585 | 4.1% | 5.4% | 10,274 | 1.8% | 2.5% |
FBN[8]
▪ H1 volumes broadly flat excluding Q1 impact of Capri Sun de-listing.
▪ Double-digit volume growth in Monster across all markets driven by innovation with new listings for Monster Green & Ultra in the Netherlands.
▪ France sugar tax increase contributed to volume decline of Coca-Cola Original Taste, partly offset by strong double-digit growth of Sprite driven by new listings.
▪ H1 revenue/UC[10] growth driven by headline price increases, positive pack mix & the sugar tax increase in France.
Germany
• Q2 volume growth supported by timing of Easter; H1 low single-digit volume decline driven by the Home channel.
• Double-digit growth in Coca-Cola Zero Sugar & Monster, supported by Q2 launch of Rio Punch & Strawberry Dreams.
• H1 revenue/UC[10] growth driven by annualisation of headline price increase implemented in Q3 last year & positive pack mix.
Great Britain
• H1 low single-digit volume growth driven by improved performance in AFH, better weather in June & innovation (e.g. double-digit volume increase in both Monster & Dr. Pepper). Diet Coke performance also improved.
• Strong ARTD growth supported by launch of Jack Daniel's & Cherry Coca-Cola & new multipacks.
• H1 revenue/UC[10] growth supported by phasing on headline price increase (Q2 versus Q3 LY) & also reflects recent increase in sugar tax.
• Growth of Monster, Jack Daniel's & Coca-Cola & de-listing of Capri Sun supported positive brand mix.
Iberia[9]
• Slight volume decline driven by transition from Nestea to FuzeTea which is progressing ahead of plan. Volumes excluding transition impact low single-digit growth.
• Continued strong growth in Sports with Aquarius & in Energy with Monster, supported by new launches & great execution.
• H1 revenue/UC[10] growth driven by headline price increase.
Australia / Pacific[11]
• Mid-single digit increase in H1 volumes driven by growth in Australia & the Pacific Islands.
• Strong growth in Coca-Cola Zero Sugar & improving performance of Diet Coke driving growth in overall Coke trademark volumes.
• Fanta performed well with high single-digit volume growth supported by the Q1 launch of Fanta Lemon in Australia.
• Energy volumes grew double-digit, supported by innovation (e.g. Q1 launch of Ultra Ruby Red & Strawberry Dreams) alongside strong growth of the original Ultra White variant during Q2.
• Revenue/UC[10] solid growth driven by headline price increases & pack mix benefit from the growth of mini cans & smaller PET in Australia.
Southeast Asia[4],[12]
• Mid-single digit increase in H1 volumes in the Philippines (cycling H1'24 +17%) driven by continued growth of Coca-Cola Original Taste & Wilkins Pure water, especially in modern trade. Coca-Cola Zero Sugar also performed strongly though from a small base.
• Volume declines in Indonesia driven by a softer Ramadan festive period reflecting a weaker consumer & macroeconomic backdrop. The ongoing geopolitical situation in the Middle East also remained a factor.
• Revenue/UC[10] growth driven by headline price increases in the Philippines implemented during Q4 last year.
SECOND QUARTER & FIRST HALF VOLUME PERFORMANCE BY CATEGORY[1],[4],[6]
All values are unaudited and all references to volumes are on an adjusted comparable basis. All changes are versus prior year equivalent period unless stated otherwise.
Second Quarter | First Half | |||
% of Total | % Change | % of Total | % Change | |
Coca-Cola® | 59.5% | 1.2% | 59.1% | 0.4% |
Flavours & Mixers | 21.0% | (1.4)% | 21.7% | (1.3)% |
Water, Sports, RTD Tea & Coffee[13] | 11.8% | (0.8)% | 11.6% | (0.5)% |
Other inc. Energy | 7.7% | 11.5% | 7.6% | 6.2% |
Total | 100.0% | 1.1% | 100.0% | 0.3% |
Coca-Cola®
Q2: +1.2%; H1: +0.4%
• Return of 'Share A Coke' campaign, well executed & received by consumers.
• Coca-Cola Original Taste H1 -1.1%, with improved Q2 volumes driven by growth in the Philippines and a stronger performance in Europe.
• Coca-Cola Zero Sugar H1 +4.7% with growth in both Europe & APS.
• Improved Diet Coke performance in Europe & APS supported by 'This is My Taste' campaign.
Flavours & Mixers
Q2: -1.4%; H1: -1.3%
• Sprite H1 -1.0% with solid growth in Europe driven by new listings in FBN, offset by decline in Indonesia
• Fanta H1 -2.5% with improved Q2 performance in Europe supported by new variants & 'Wanta Fanta' campaign, offset by Q2 APS decline.
• Strong double-digit volume increase for Dr. Pepper in GB driven by new Cherry Crush variant.
Water, Sports, RTD Tea & Coffee[13]
Q2: -0.8%; H1: -0.5%
• Water +3.6% driven by growth of Wilkins Pure in the Philippines, Aquabona in Iberia & Chaudfontaine in FBN.
• H1 Sports +2.7% (Q2 +4.2%) driven by Aquarius in Spain, supported by the launch of new Red Peach variant.
• RTD Tea & Coffee -12.6% driven by Frestea decline in Indonesia & transition from Nestea to Fuze Tea in Spain, which is nevertheless ahead of plan.
Other inc. Energy
Q2: +11.5% (+17.0% exc. Juices)
H1: +6.2% (+13.6% exc. Juices)
• Strong growth in Energy with H1 +14.6% (Q2 +16.8%) driven by growth of new variants e.g. Rio Punch & Mango Loco & continued strength of Ultra.
• Juices decline of -13.6% in H1 (Q2 -5.5%) resulting from strategic de-listing of Capri Sun in Europe which has now fully annualised.
• Ongoing rollout of ARTD portfolio continues to perform strongly following Q1 launch of Bacardi & Coke, Jack Daniel's & Coca-Cola Cherry & Absolut Sprite Watermelon.
Conference Call
• 6 August 2025 at 12:00 BST, 13:00 CEST & 7:00 a.m. EDT; accessible via www.cocacolaep.com
• Replay & transcript will be available at www.cocacolaep.com as soon as possible
Financial Calendar
• Third quarter trading update: 5 November 2025
• Financial calendar available here: https://ir.cocacolaep.com/financial-calendar/
Contacts
Investor Relations
Sarah Willett | Charles Richardson | Matt Sharff | Dimitar Todorchev |
Media Relations Contacts
About CCEP
Coca-Cola Europacific Partners is one of the world's leading consumer goods companies. We make, move and sell some of the world's most loved brands - serving nearly 600 million consumers and helping over 4 million customers across 31 countries grow.
We combine the strength and scale of a large, multi-national business with an expert, local knowledge of the customers we serve and communities we support.
The Company is currently listed on Euronext Amsterdam, NASDAQ, London Stock Exchange and on the Spanish Stock Exchanges, and a constituent of both the NASDAQ 100 and FTSE 100 indices, trading under the symbol CCEP (ISIN No. GB00BDCPN049)
For more information about CCEP, please visit www.cocacolaep.com & follow CCEP on LinkedIn
___________________________
1. Refer to 'Note Regarding the Presentation of Adjusted financial information and Alternative Performance Measures' for further details & to 'Supplementary Financial Information' for a reconciliation of reported to comparable and reported to adjusted comparable results; Change percentages against prior year equivalent period unless stated otherwise
2. A unit case equals approximately 5.678 litres or 24 8-ounce servings
3. Comparable & FX-neutral
4. Non-IFRS adjusted comparable financial information as if the acquisition of Coca-Cola Beverages Philippines, Inc (CCBPI) occurred at the beginning of 2024 for illustrative purposes only. It does not intend to represent the results had the acquisition occurred at the dates indicated or project the results for any future dates or periods. Acquisition completed on 23 February 2024. Prepared on a basis consistent with CCEP IFRS accounting policies and includes acquisition accounting adjustments for the period 1 January to 23 February. Refer to 'Note Regarding the Presentation of Adjusted financial information and Alternative Performance Measures' for further details.
5. External data sources: Nielsen & IRI Period 5 YTD
6. Reflects selling day shift with 2 fewer selling days in H1'25 versus H1'24. Excluding the selling days adjusted volumes were CCEP -1.3% (Europe -1.9%, APS -0.1%)
7. Dividends subject to Board approval
8. Includes France, Monaco, Belgium, Luxembourg, the Netherlands, Norway, Sweden & Iceland
9. Includes Spain, Portugal & Andorra
10. Revenue per unit case
11. Includes Australia, New Zealand, the Pacific Islands & Papua New Guinea
12. Includes Philippines & Indonesia
13. RTD refers to ready to drink
14. As of 30 July 2025
Click on, or paste the following link into your web browser, to view the associated PDF document.
http://www.rns-pdf.londonstockexchange.com/rns/1276U_1-2025-8-5.pdf
This information is provided by RNS, the news service of the London Stock Exchange. RNS is approved by the Financial Conduct Authority to act as a Primary Information Provider in the United Kingdom. Terms and conditions relating to the use and distribution of this information may apply. For further information, please contact [email protected] or visit www.rns.com.
SOURCE: Coca-Cola Europacific Partners plc
View the original press release on ACCESS Newswire
M.White--AT