Champions Oncology Reports Quarterly Revenue of $13.5 Million Adjusted EBITDA of $1.1 Million

 Indonesia's main airport suspends operations after volcanic eruption

 US aircraft carrier departs Thailand after port call

 Haze emergency grips Malaysian Borneo town

 Messi creates both Miami goals in 2-2 draw with Atlanta

 Rybakina books US Open fourth-round berth, inches closer to No. 1

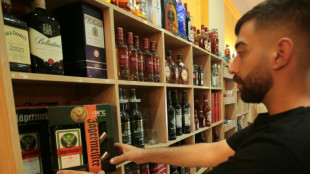 Sobering reality: Curbs on alcohol in northeast Syria cause discontent

 Wobbly Osaka 'shocked' to battle past Mertens and reach last 16

 Indian Oscar-nominated filmmaker turns camera on his cancer

 Argentina 'let off hook' by Australia as Kiss's winning run ends

 Argentina threatens to sanction oil projects around Falklands

 Gauff into round four at US Open after straight-set win

 Bordeaux hammer Racing in Top 14 start as Bielle-Biarrey extends deal

 Zheng, Potapova pull off upsets to reach US Open last 16

 Swiatek into US Open fourth round in tight two-setter

 Werro wins in Brussels, as Russell and Dos Santos shine
 Kolbe breaks jaw and shoulder injury sidelines Savea

 US military strikes oil tankers as Iran vows tougher reprisals

 Zheng rallies to stun Keys, Anisimova out in US Open third round
 Bayern held to draw by stubborn Schalke

 Lens lose again ahead of Champions League date

 Olympic champion Zheng storms home to reach US Open last 16

 Big-spending Spurs must make better attacking decisions, says De Zerbi

 South Africa dominate New Zealand in second half to lead series
 Kiefer Sutherland still in action, but ibuprofen lending helping hand

 'Are we ready?' Oasis film captures band's frosty reunion

Champions Oncology, Inc. (Nasdaq:CSBR), a global preclinical and clinical research services provider that offers end-to-end oncology solutions, today announced its financial results for its second quarter of fiscal 2025, ended October 31, 2024.
Second Quarter and Recent Highlights:
Total revenue increased 17% to $13.5 million
Gross profit of $6.1 million; margin of 45%
Net income of approximately $730,000
Adjusted EBITDA of $1.1 million
Development of new data revenue stream
First Half 2025 Highlights:
Total revenue increased 14% to $27.6 million
Gross profit of $13.1 million; margin of 47%
Net income of $2.1 million
Adjusted EBITDA of $3.2 million
Ronnie Morris, CEO of Champions, commented, "Our second quarter's performance solidified our confidence in the Company's turnaround that we've been discussing the last several quarters. We remain cautiously optimistic that the pharma and biotech environment is improving which will continue to contribute to our long-term growth." Morris added, "In addition to our core business, we made significant strides in monetizing our data platform, establishing an additional revenue stream that can be transformative for the Company."
David Miller, CFO of Champions, added, "We continued to deliver strong financial results in our second quarter as revenue increased 17% to $13.5M while we reduced total costs by $771,000. As a result, we recorded adjusted EBITDA of $1.1 million." Miller added, "With the renewed underlying strength in our core business coupled with the expected revenue contribution from our data platform, we're projecting revenue growth for the year of at least 10% - 15%."
Second Fiscal Quarter Financial Results
Total revenue for the second quarter of fiscal 2025 was $13.5 million compared to $11.6 million for the same period last year, an increase of 17%. The combination of operational improvements and efficiencies implemented, which led to an increase in our revenue conversion percentage, and the acceleration in our bookings, generated an increase in revenue for both the three months and six months ended October 31, 2024. Total costs and operating expenses for the second quarter of fiscal 2025 were $12.8 million compared to $13.5 million for the second quarter of fiscal 2024, a decrease of $771,000 or 5.7%.
For the second quarter of fiscal 2025, Champions reported income from operations of $732,000, including $9,000 in stock-based compensation and $399,000 in depreciation and amortization expenses, compared to a loss from operations of $2.0 million, inclusive of $53,000 in stock-based compensation and $484,000 in depreciation and amortization expenses, in the second quarter of fiscal 2024. Excluding stock-based compensation, depreciation and amortization expenses, Champions reported adjusted EBITDA of $1.1 million for the second quarter of fiscal 2025 compared to an adjusted EBITDA loss of $1.4 million in the second quarter of fiscal 2024.
Cost of oncology services was $7.4 million for the three-months ended October 31, 2024, an increase of $810,000, or 12.2% compared to $6.6 million for the three-months ended October 31, 2023. The increase in cost of oncology services was primarily from an increase in mice and lab costs to support revenue growth. For the three-months ended October 31, 2024, total margin was 45% compared to 43% for the three-months ended October 31, 2023. The improved margin resulted primarily from an increase in revenue and a lower cost base due to operational efficiencies implemented, but was under some specific pressure due to the cost of humanized mice.
Research and development expense for the three-months ended October 31, 2024 was $1.7 million, a decrease of $826,000 or 32.8%, compared to $2.5 million for the three-months ended October 31, 2023. The decrease was primarily due to reduced investment in research and development, including our target discovery program. Sales and marketing expense for the three-months ended October 31, 2024 was $1.8 million, a slight decrease of $44,000, or 2.5%, compared to $1.8 million for the three-months ended October 31, 2023. General and administrative expense for the three-months ended October 31, 2024 was $1.9 million, a decrease of $711,000, or 27.3%, compared to $2.6 million for the three-months ended October 31, 2023. The decrease was primarily from a decline in compensation and recruitment expenses and a one-time reduction in our credit loss reserve.
Net cash used in operating activities was approximately $283,000 for the three-months ended October 31, 2024 and was primarily due to an increase in accounts receivable and a decrease in accounts payable offset by net income for the quarter. Net changes in our working capital accounts were in the ordinary course of business. Net cash used in investing activities for the three-months ended October 31, 2024 was approximately $94,000 and was for lab and computer equipment. Net cash provided by financing activities for the three-months ended October 31, 2024 was approximately $239,000 resulting primarily from proceeds from options exercise.
The Company ended the quarter with cash on hand of approximately $2.8 million. The Company has no debt.
Year-to-Date Financial Results
Total revenue for the first half of fiscal 2025 was $27.6 million compared to $24.1 million for the same period last year, an increase of 14.2%. Total costs and operating expenses for the first half of fiscal 2025 were $25.5 million compared to $28.6 million for the first half of fiscal 2024, a decrease of $3.2 million or 11.0%.
For the first half of fiscal 2025, Champions reported income from operations of $2.1 million, including $267,000 in stock-based compensation and $848,000 in depreciation and amortization expenses, compared to a loss from operations of $4.5 million, inclusive of $476,000 in stock-based compensation and $929,000 in depreciation and amortization expenses, in the first half of fiscal 2024. Excluding stock-based compensation, depreciation and amortization expenses, Champions reported adjusted EBITDA of $3.2 million for the first half of fiscal 2025 compared to an adjusted EBITDA loss of $3.1 million in the first half of fiscal 2024.
Cost of oncology services was $14.5 million for the six-months ended October 31, 2024, an increase of $198,000, or 1.4% compared to $14.3 million for the six-months ended October 31, 2023. The increase in cost of oncology services was primarily from an increase in mice costs. For the six-months ended October 31, 2024, total margin was 47% compared to 41% for the six-months ended October 31, 2023. The improved margin resulted primarily from a combination of an increase in revenue while minimizing cost increases due to operational efficiencies implemented and other cost reduction initiatives.
Research and development expense for the six-months ended October 31, 2024 was $3.1 million, a decrease of $2.2 million or 40.8%, compared to $5.3 million for the six-months ended October 31, 2023. The decrease was primarily due to reduced investment in research and development in non-essential services, including our target discovery program. Sales and marketing expense for the six-months ended October 31, 2024 was $3.4 million, a slight decrease of $61,000, or 1.7%, compared to $3.5 million for the six-months ended October 31, 2023. General and administrative expense for the six-months ended October 31, 2024 was $4.4 million, a decrease of $1.1 million, or 20.3%, compared to $5.5 million for the six-months ended October 31, 2023. The decrease was primarily from a reduction in compensation, recruitment, and stock-based compensation expenses.
Conference Call Information:
The Company will host a conference call today at 4:30 p.m. EST (1:30 p.m. PST) to discuss its second quarter financial results. To participate in the call, please call 888-506-0062 (Domestic) or 973-528-0011 (International) and enter the access code 710610, or provide the verbal reference "Champions Oncology".
Full details of the Company's financial results will be available by or before December 16, 2024 in the Company's Form 10-Q at www.championsoncology.com.
* Non-GAAP Financial Information
See the attached Reconciliation of GAAP net income (loss) to Non-GAAP net income (loss) for an explanation of the amounts excluded to arrive at Non-GAAP net income (loss) and related Non-GAAP income (loss) per share amounts for the three and six months ended October 31, 2024 and 2023. Non-GAAP financial measures provide investors and management with supplemental measures of operating performance and trends that facilitate comparisons between periods before and after certain items that would not otherwise be apparent on a GAAP basis. Certain unusual or non-recurring items that management does not believe affect the Company's basic operations do not meet the GAAP definition of unusual or non-recurring items. Non-GAAP net income (loss) and Non-GAAP income (loss) per share are not, and should not, be viewed as a substitute for similar GAAP items. Champions defines Non-GAAP dilutive income (loss) per share amounts as Non-GAAP net income (loss) divided by the weighted average number of diluted shares outstanding. Champions' definition of Non-GAAP net income (loss) and Non-GAAP diluted income (loss) per share may differ from similarly named measures used by other companies and may not be applicable for the current reporting period.
About Champions Oncology, Inc.
Champions Oncology is a global preclinical and clinical research services provider that offers end-to-end oncology R&D solutions to biopharma organizations. With the largest and most annotated bank of clinically relevant patient-derived xenograft (PDX) and primary hematological malignancy models, Champions delivers innovative highest-quality data through proprietary in vivo and ex vivo platforms. Through its large portfolio of cutting-edge bioanalytical platforms, groundbreaking data platform and analytics, and scientific excellence, Champions enables the advancement of preclinical and clinical oncology drug discovery and development programs worldwide. For more information, please visit www.ChampionsOncology.com.
This press release may contain "forward-looking statements" (within the meaning of the Private Securities Litigation Act of 1995) that inherently involve risk and uncertainties. Champions Oncology generally uses words such as "believe," "may," "could," "will," "intend," "expect," "anticipate," "plan," and similar expressions to identify forward-looking statements. One should not place undue reliance on these forward-looking statements. The Company's actual results could differ materially from those anticipated in the forward-looking statements for many unforeseen factors. See Champions Oncology's Form 10-K for the fiscal year ended April 30, 2024 for a discussion of such risks, uncertainties and other factors. Although the Company believes the expectations reflected in the forward-looking statements are reasonable, they relate only to events as of the date on which the statements are made, and Champions Oncology's future results, levels of activity, performance or achievements may not meet these expectations. The Company does not intend to update any of the forward-looking statements after the date of this press release to conform these statements to actual results or to changes in Champions Oncology's expectations, except as required by law.
Champions Oncology, Inc.
(Dollars in thousands)
Reconciliation of GAAP to Non-GAAP Net Income (Loss) (Unaudited)
Three Months Ended October 31, | Six Months Ended October 31, | ||||||||||
2024 | 2023 | 2024 | 2023 | ||||||||
Net income (loss) - GAAP | $ | 728 | $ | (2,071 | ) | $ | 2,041 | $ | (4,637 | ) | |
Less: | |||||||||||
Stock-based compensation | 9 | 53 | 267 | 476 | |||||||
Net income (loss) - Non-GAAP | $ | 737 | $ | (2,018 | ) | $ | 2,308 | $ | (4,161 | ) | |
Reconciliation of GAAP EPS to Non-GAAP EPS (Unaudited)
Three Months Ended October 31, | Six Months Ended October 31, | |||||||||||
2024 | 2023 | 2024 | 2023 | |||||||||
EPS - GAAP, basic | $ | 0.05 | $ | (0.15 | ) | $ | 0.15 | $ | (0.34 | ) | ||
Less: | ||||||||||||
Effect of stock-based compensation on EPS | - | - | 0.02 | 0.04 | ||||||||
EPS - Non-GAAP, basic | $ | 0.05 | $ | (0.15 | ) | $ | 0.17 | $ | (0.30 | ) | ||
Three Months Ended October 31, | Six Months Ended October 31, | |||||||||||
2024 | 2023 | 2024 | 2023 | |||||||||
EPS - GAAP, diluted | $ | 0.05 | $ | (0.15 | ) | $ | 0.15 | $ | (0.34 | ) | ||
Less: | ||||||||||||
Effect of stock-based compensation on EPS | - | - | 0.02 | 0.04 | ||||||||
EPS - Non-GAAP, diluted | $ | 0.05 | $ | (0.15 | ) | $ | 0.17 | $ | (0.30 | ) | ||
Unaudited Condensed Consolidated Statements of Operations (unaudited)
Three Months Ended October 31, | Six Months Ended October 31, | |||||||||||
2024 | 2023 | 2024 | 2023 | |||||||||
Oncology services revenue | $ | 13,489 | $ | 11,573 | $ | 27,550 | $ | 24,134 | ||||
Cost of oncology services | 7,428 | 6,618 | 14,500 | 14,302 | ||||||||
Research and development | 1,689 | 2,515 | 3,143 | 5,308 | ||||||||
Sales and marketing | 1,751 | 1,795 | 3,430 | 3,491 | ||||||||
General and administrative | 1,889 | 2,600 | 4,416 | 5,540 | ||||||||
Income (loss) from operations | 732 | (1,955 | ) | 2,061 | (4,507 | ) | ||||||
Other income (expense) | 7 | (105 | ) | 11 | (91 | ) | ||||||
Income (loss) before provision for income taxes | 739 | (2,060 | ) | 2,072 | (4,598 | ) | ||||||
Provision for income taxes | 11 | 11 | 31 | 39 | ||||||||
Net income (loss) | $ | 728 | $ | (2,071 | ) | $ | 2,041 | $ | (4,637 | ) | ||
Net income (loss) per common share outstanding | ||||||||||||
basic | $ | 0.05 | $ | (0.15 | ) | $ | 0.15 | $ | (0.34 | ) | ||
and diluted | $ | 0.05 | $ | (0.15 | ) | $ | 0.15 | $ | (0.34 | ) | ||
Weighted average common shares outstanding | ||||||||||||
basic | 13,593,766 | 13,497,061 | 13,593,766 | 13,529,629 | ||||||||
and diluted | 13,969,967 | 13,497,061 | 14,006,173 | 13,529,629 | ||||||||
Condensed Consolidated Balance Sheets
October 31, | April 30, | |||
(unaudited) | ||||
Cash and cash equivalents | $ | 2,754 | $ | 2,618 |
Accounts receivable, net | 10,470 | 9,526 | ||
Other current assets | 860 | 1,495 | ||
Total current assets | 14,084 | 13,639 | ||
Operating lease right-of-use assets, net | 5,669 | 6,252 | ||
Property and equipment, net | 4,967 | 5,721 | ||
Other long term assets | 185 | 185 | ||
Goodwill | 335 | 335 | ||
Total assets | $ | 25,240 | $ | 26,132 |
Accounts payable and accrued liabilities | $ | 7,089 | $ | 7,960 |
Current portion of operating lease liabilities | 1,401 | 1,337 | ||
Other current liabilities | 151 | 150 | ||
Deferred revenue | 10,220 | 12,094 | ||
Total current liabilities | 18,861 | 21,541 | ||
Non-current operating lease liabilities | 5,374 | 6,093 | ||
Other Non-current Liability | 324 | 401 | ||
Total liabilities | 24,559 | 28,035 | ||
Stockholders' equity (deficit) | 681 | (1,903 | ) | |
Total liabilities and stockholders' equity (deficit) | $ | 25,240 | $ | 26,132 |
Unaudited Condensed Consolidated Statements of Cash Flows (unaudited)
Six Months Ended October 31, | ||||||
2024 | 2023 | |||||
Cash flows from operating activities: | ||||||
Net income (loss) | $ | 2,041 | $ | (4,637 | ) | |
Adjustments to reconcile net income (loss) to net cash provided by (used in) operations: | ||||||
Stock-based compensation expense | 267 | 476 | ||||
Operating lease right-of use assets | 583 | 502 | ||||
Depreciation and amortization expense | 848 | 929 | ||||
Loss on disposal of equipment | - | 65 | ||||
Allowance for doubtful accounts and estimated credit losses | (280 | ) | 234 | |||
Changes in operating assets and liabilities | (3,431 | ) | (971 | ) | ||
Net cash provided by (used in) operating activities | 28 | (3,402 | ) | |||
Cash flows from investing activities: | ||||||
Purchases of property and equipment | (94 | ) | (747 | ) | ||
Net cash used in investing activities: | (94 | ) | (747 | ) | ||
Cash flows from financing activities: | ||||||
Repurchases of common stock | - | (634 | ) | |||
Proceeds from the exercise of stock options | 276 | 252 | ||||
Finance lease payments | (74 | ) | (74 | ) | ||
Net cash provided by (used in) financing activities: | 202 | (456 | ) | |||
Net increase (decrease) in cash | 136 | (4,605 | ) | |||
Cash at beginning of period | 2,618 | 10,118 | ||||
Cash at the end of period | $ | 2,754 | $ | 5,513 | ||
SOURCE: Champions Oncology, Inc.
Ch.Campbell--AT